
Price action in both the UAE MSCI and S&P 500 has been consolidating for several months, leaving each market at a key technical juncture. The direction of any breakout could offer insight into the health of UAE and US markets as risk sentiment remains subdued, crude oil prices stay elevated, and major earnings reports and elections approach.
The UAE MSCI tracks the performance of large- and mid-cap UAE equities, with financial stocks carrying the largest sector weighting. The S&P 500, meanwhile, reflects the performance of leading US companies. Both indices are showing similar consolidation patterns and currently have a neutral-to-positive correlation.
I cover these charts in my weekly webinars, held every Tuesday 12:30 PM GST
Key catalysts for both markets include technology and AI earnings, crude oil prices, geopolitical developments, and the approaching Israeli and US elections on October 27 and November 3, respectively.
Regional tensions and attacks on shipping and energy infrastructure could have a more direct impact on UAE markets, given their sensitivity to regional developments, crude oil and inflation. Changes in expectations for AI and technology companies may have a more direct effect on the S&P 500, with potential spillover to UAE markets through their exposure to technology and AI investment across sectors.
Against this backdrop, the patterns on both charts may offer clues about market direction ahead of megacap earnings, central-bank decisions and elections in the coming weeks.
S&P 500 Price Outlook: Daily Time Frame – Log Scale
Source: TradingView
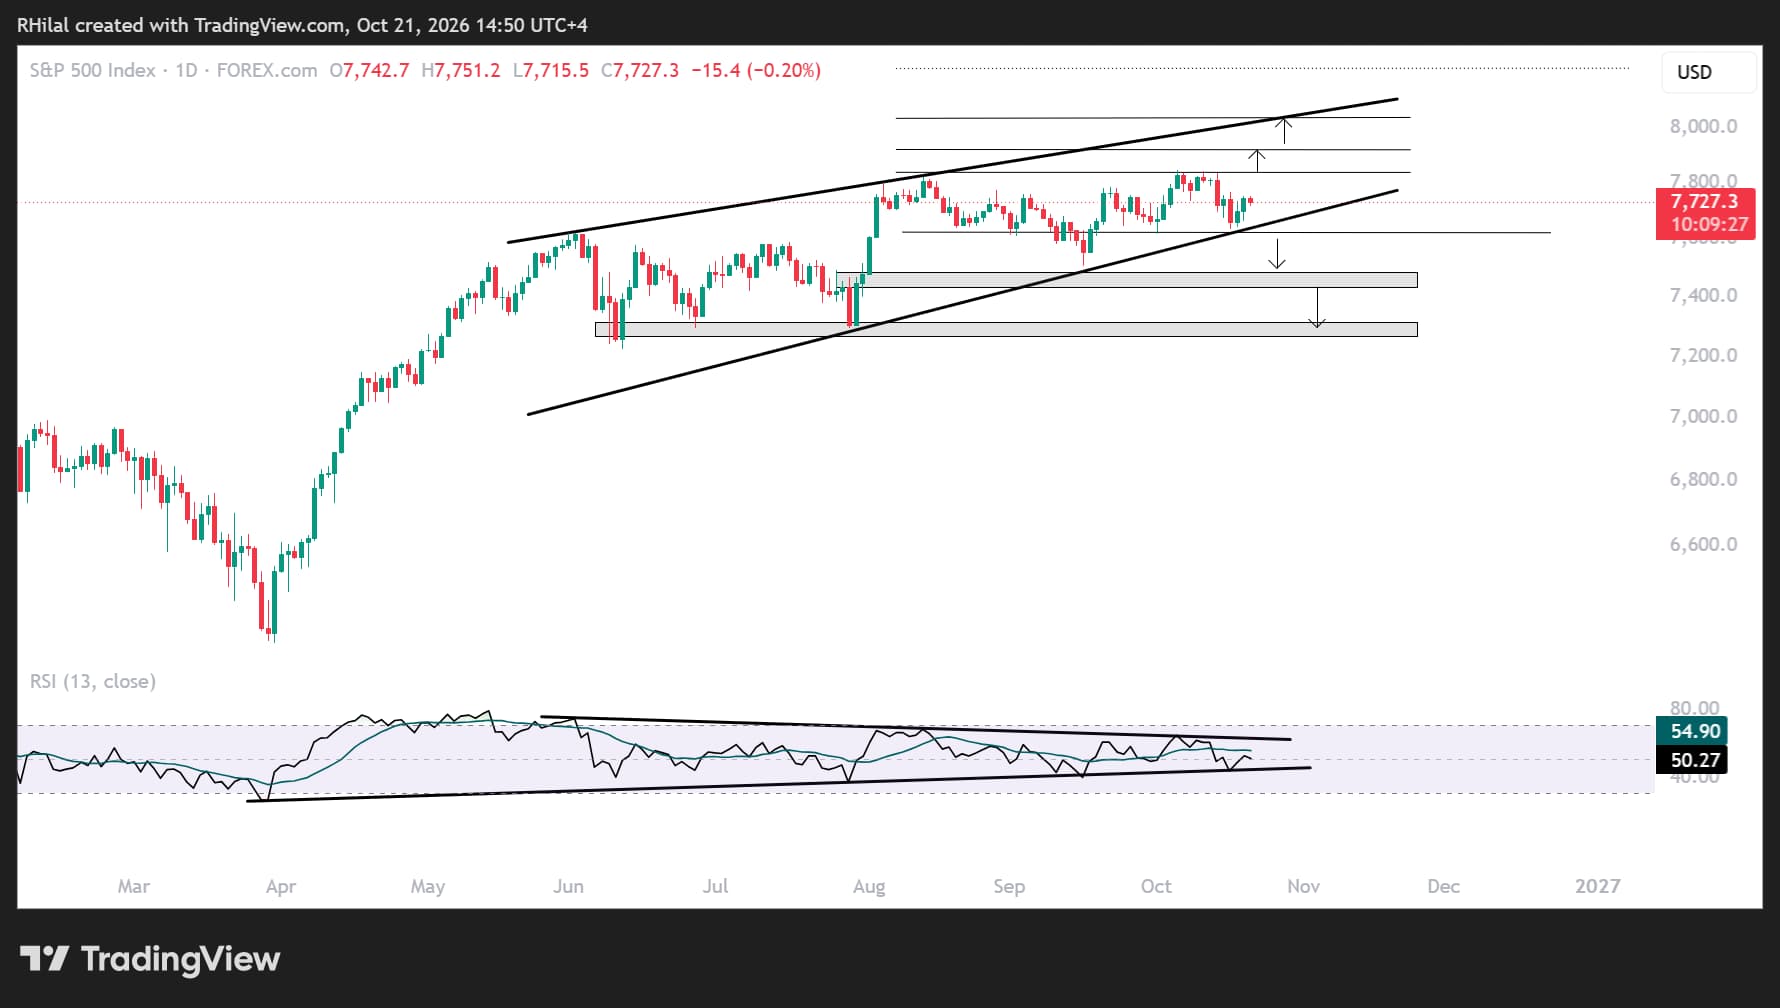
The S&P 500 has been coiling within a contracting consolidation on both the daily price chart and RSI for nearly five months. In technical analysis, a prolonged consolidation can precede a sharp breakout, although the direction is not clear until price confirms it. With major catalysts approaching—including technology and AI earnings, the Israeli election and the US midterm elections—a significant move may be on the horizon.
On the weekly chart, a bearish divergence between price and RSI highlights drawdown risks. Those risks could increase if geopolitical developments deteriorate and weigh on technology and AI company margins. The divergence coincides with RSI overbought levels last seen in September 2025 and July 2024.
A break below 7,610 would confirm the bearish scenario and expose the 27.2% retracement of the March–August advance near 7,420. This could be an area for a short-term rebound; a deeper decline would bring the 38.2% retracement near 7,250 into focus. That level also marks a support zone respected in June and July 2026.
On the upside, the index has pulled back twice from its record high near 7,830, which aligns with the 78.6% extension of the April 22, 2025–January 28, 2026–March 31, 2026 move. A breakout above the record high would expose the 100% extension near 8,240. In the shorter term, resistance may emerge around 7,900–7,920 and 8,000–8,030, along the rising trendline connecting higher highs from June to August.
UAE MSCI Price Outlook: Weekly Time Frame – Log Scale
Source: TradingView
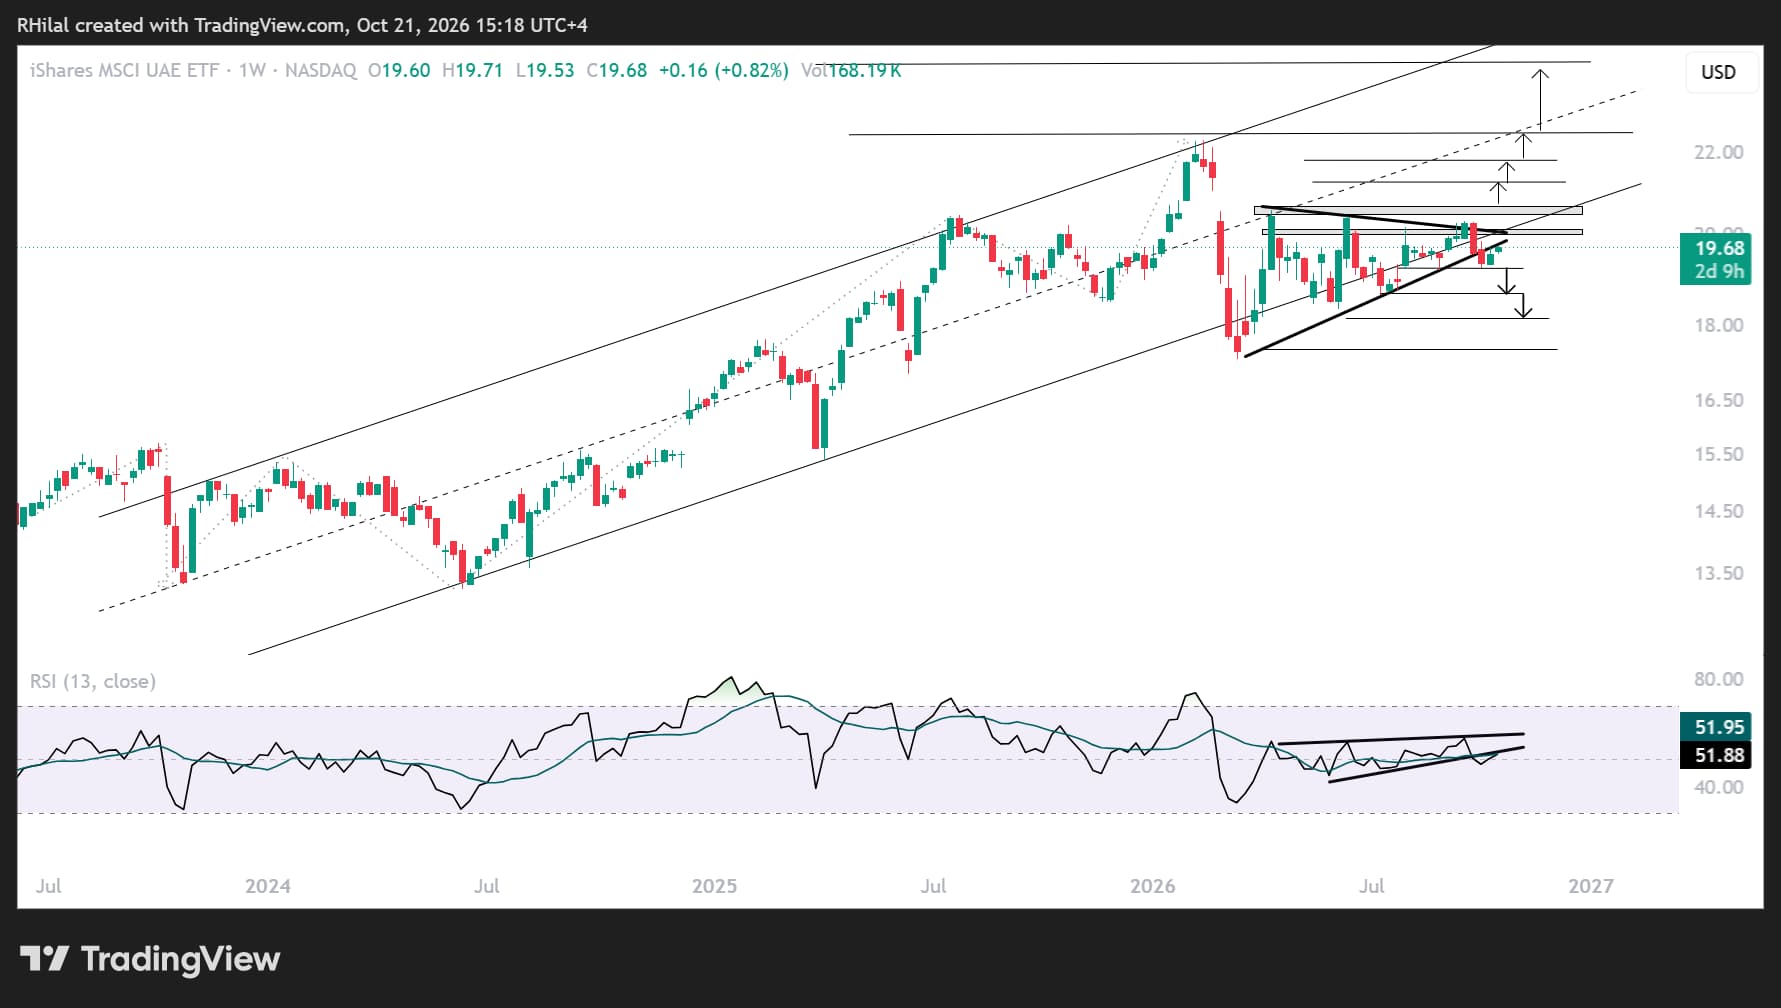
UAE markets may be directly affected by regional tensions and attacks on shipping through the Strait of Hormuz and on energy infrastructure. Bearish risks remain in focus as the index trades slightly below the boundary of its rising channel, respected since 2023, and the contracting consolidation that has been in place since March 2026.
Price and RSI are retesting the boundaries of this multi-month consolidation from below, leaving both bearish and bullish continuation scenarios in play. The key resistance zone is 19.75–19.87. A breakout above this zone would bring the index back in line with its bullish structure since 2023. Resistance near 20.30 would then be the next level to clear to confirm a potential continuation toward the yearly highs, possibly alongside improving risk sentiment and a more favorable geopolitical outlook.
On the downside, breaks below 19.20 and then 18.60 would increase bearish risks and bring the yearly lows into focus. A move below 18.60 could also put the three-year uptrend at risk, particularly if geopolitical conditions worsen.
For now, both charts retain a neutral-to-bullish bias, but confirmation is still needed. The boundaries of each multi-month consolidation provide key levels to monitor for a potential shift in direction and can help frame risk-management decisions.
Written by Razan Hilal, CMT
Follow on X: @Rh_waves