


US Dollar Price Action Setups: EUR/USD, GBP/USD, USD/JPY, Gold
The next few days are probably going to be intense with the Fed, ECB, BoE and BoC all hosting rate decisions. Meanwhile gold broke down early in the session and tries to grasp on to support amidst a rally in the DXY basket.
Share this:

Daily charts for DXY are messy as what I think was a bad tick to start this week obscures the technical backdrop. I explained that in the early part of this webinar but on a shorter-term basis, it’s the reaction to support at 98.28 that stands out, with a stark run of strength as markets have priced down the probably of a rate cut from the Fed later this year.
As usual, I have setups on either side of the USD for this webinar and I’ll explore some of those high points below.
US Dollar Four-Hour Price Chart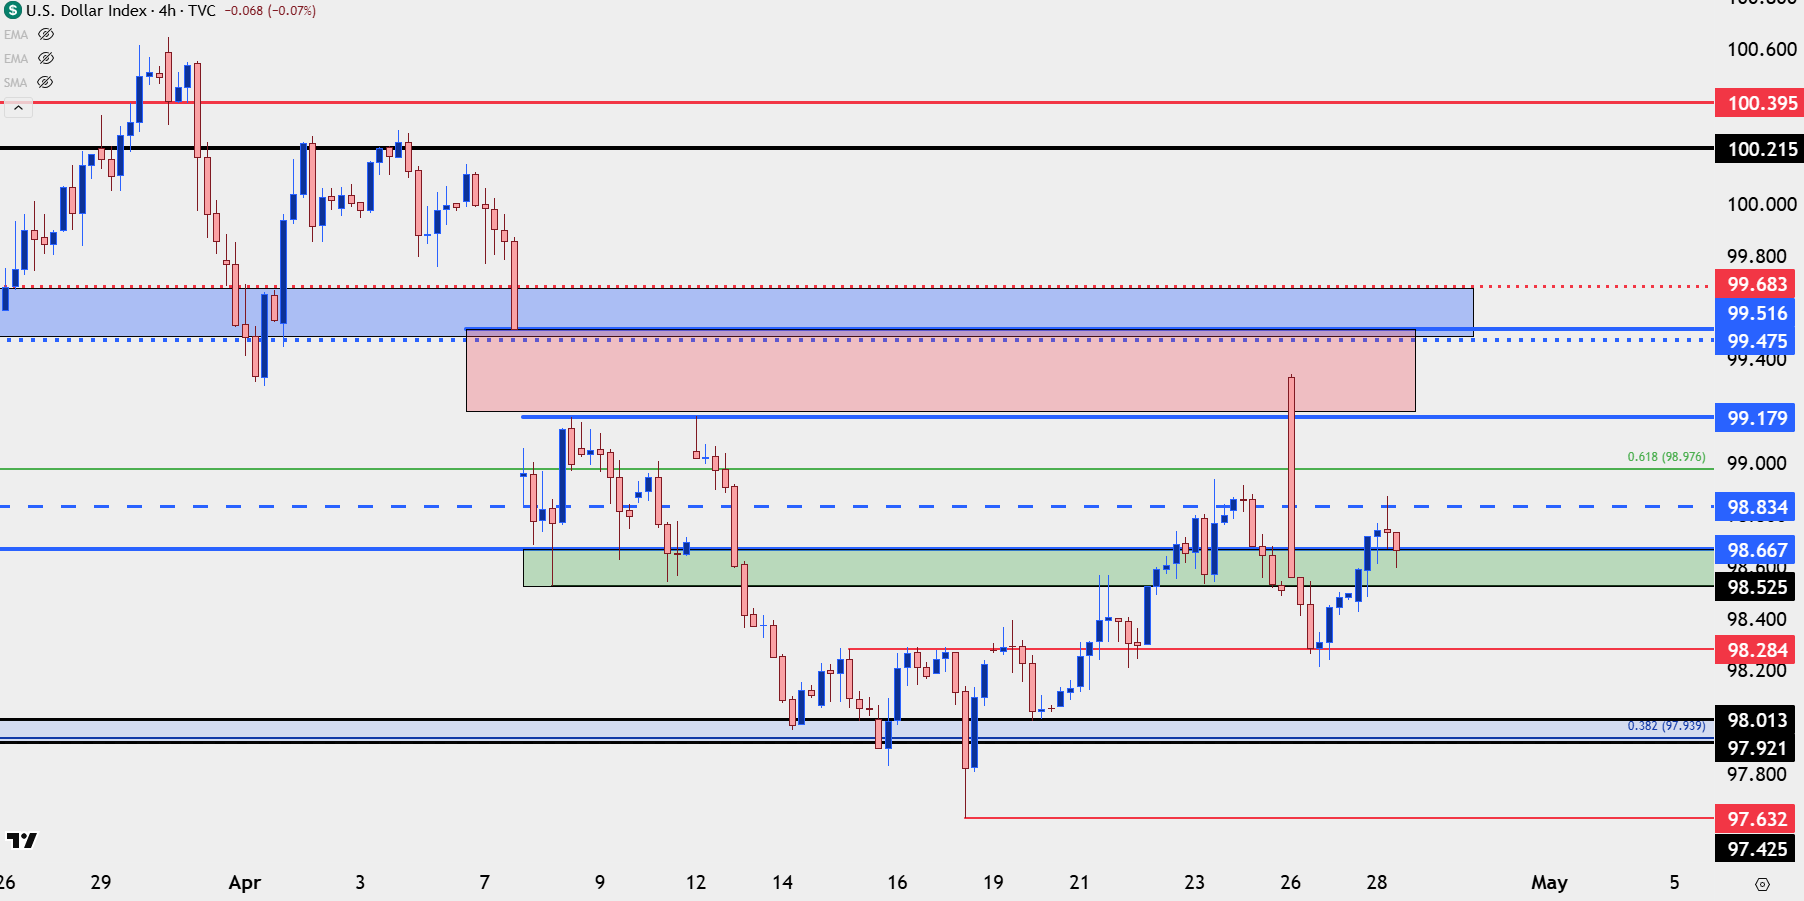
Chart prepared by James Stanley; data derived from Tradingview
EUR/USD
I’m keeping EUR/USD as a setup for bearish USD strategies going into FOMC but at this point, bulls haven’t exactly taken control, although we may be at the early stages of that. There’s an attempted hold at the 1.1686 Fibonacci level and if today’s low remains in place through the close, this would qualify as a higher-low. So far, there’s been resistance at prior support, from around 1.1748-1.1766 so that’s the spot that bulls need to beat to continue this stalling into a short-term bullish trend, that could amount to bigger picture bullish resumption at which point 1.1835 comes back on the radar.
EUR/USD Daily Price Chart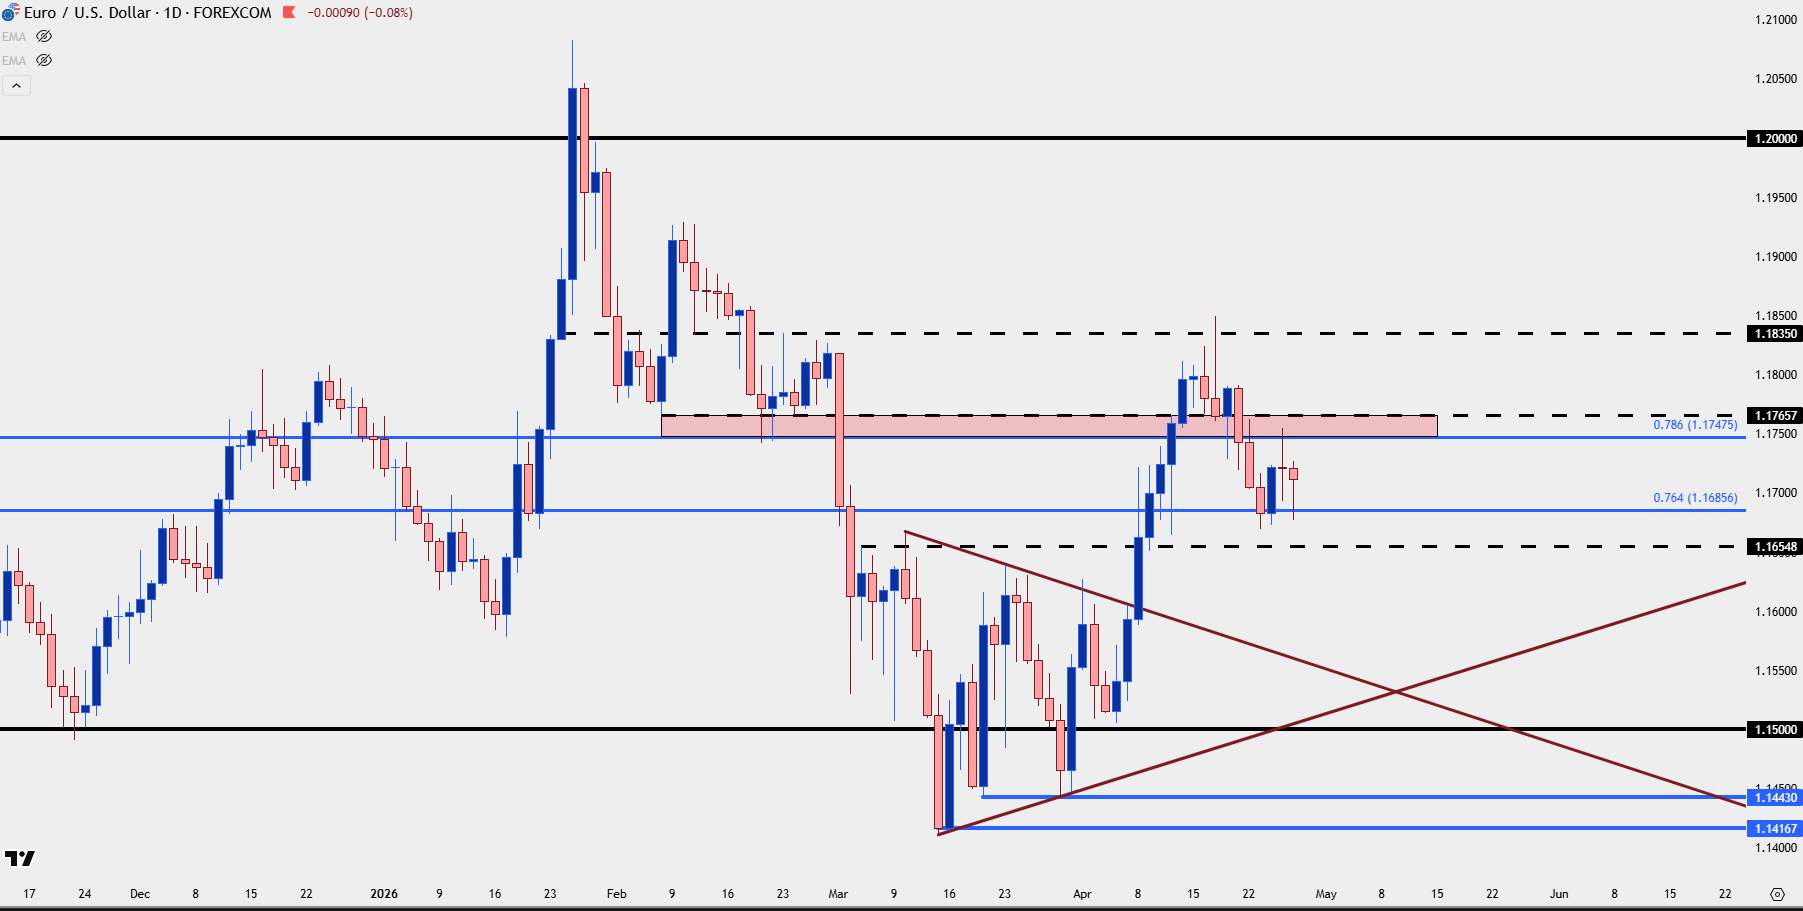
Chart prepared by James Stanley; data derived from Tradingview
GBP/USD
I looked into the British Pound yesterday across a few different pairings and as I shared there, I think there’s a case for GBP being a more attractive candidate for USD-weakness than the Euro. Much of that sources from the chart of the cross pair in EUR/GBP, but in the major of GBP/USD, there’s been a higher-low support hold and as I showed in the webinar, that looks a bit cleaner in GBP/USD than EUR/USD. Also, in GBP/USD there’s a hold of support in a key zone, running from 1.3484-1.3500, which has so far led to a bounce.
Next resistance overhead is at the 1.3568 level, after which 1.3600 comes into the picture. That’s a big spot that so far bulls have not been able to do much above.
GBP/USD Four-Hour Price Chart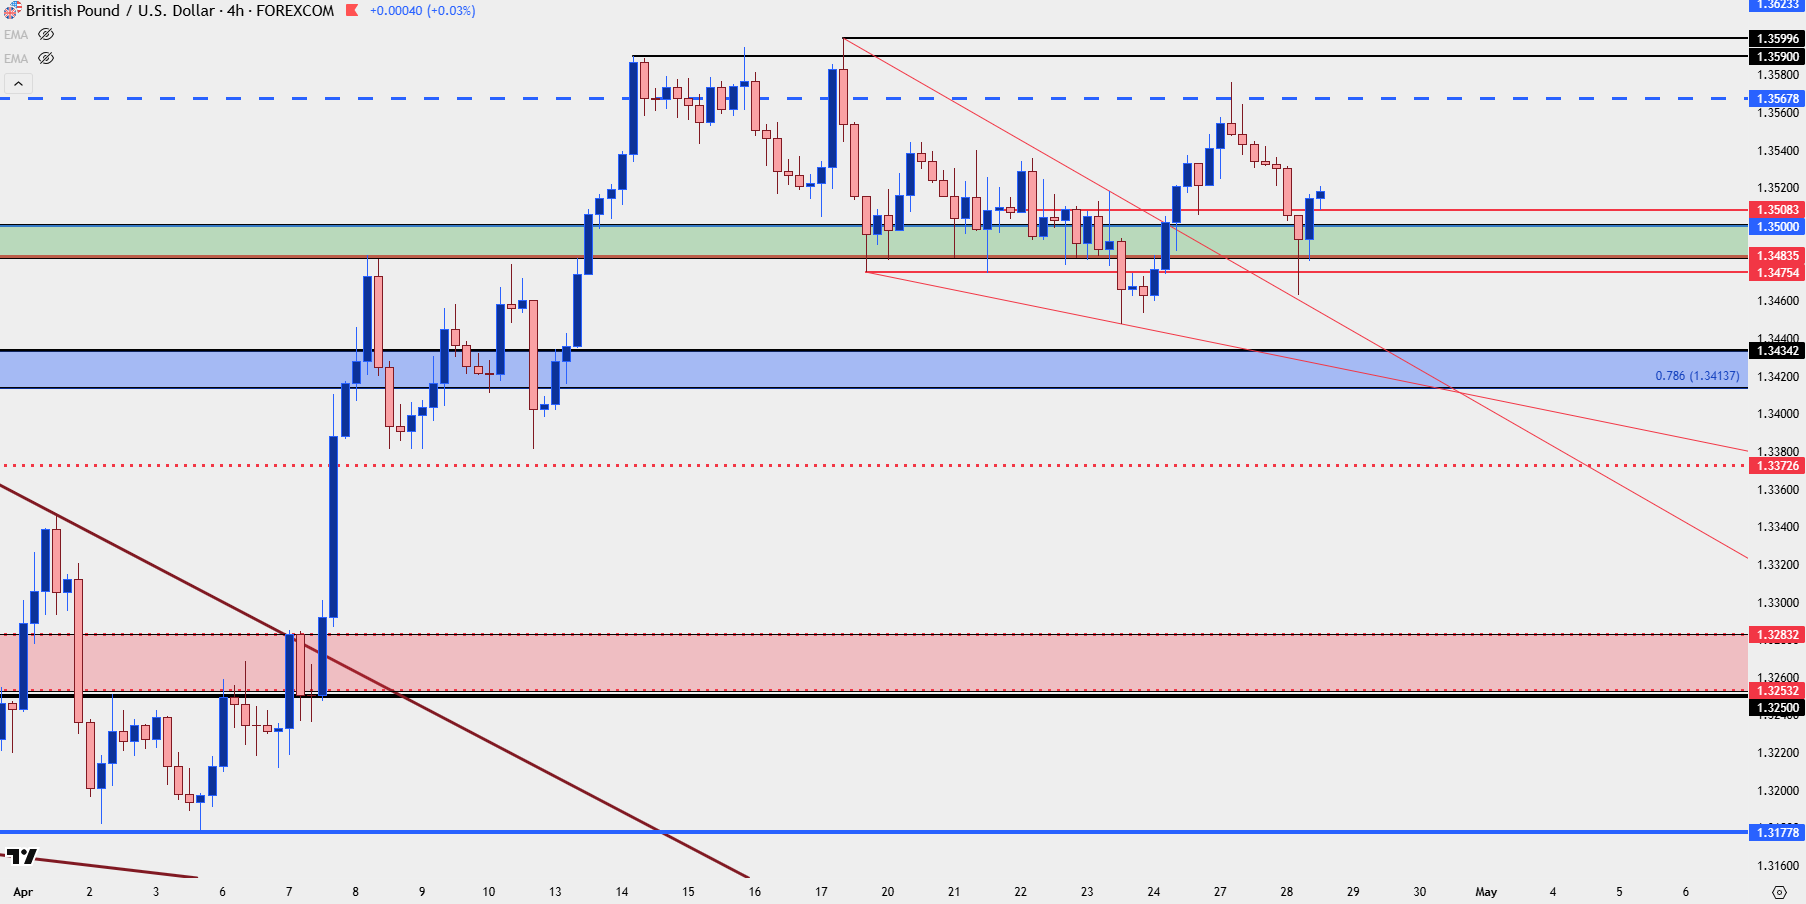
Chart prepared by James Stanley; data derived from Tradingview
USD/JPY
A hawkish Ueda in January helped to fuel a massive sell-off in USD/JPY as markets geared up for the possibility of narrowing rate differentials. That dip was ultimately bought up by longs and eventually price scaled back up to the 160.00 level. But notably there’s been a different response to this iteration of a hawkish Ueda, where prices have held very close to the 160.00 level in the USD/JPY pair.
As I’ve been saying, I think there’s a backdrop that can support a breakout particularly if we see tensions in the Middle East leading to higher oil prices and a stronger US Dollar. In that scenario, the Bank of Japan may not find a quick intervention to be so simple, instead choosing to not burn finite FX reserves to defend a spot rate that’s already been traded through. Instead, it’s the 161.95 and 165.00 levels sitting overhead that could make for a more strategic line-in-the-sand should a breakout take hold.
With that said – for a breakout to hit we’re likely going to need to hear or see Powell take a hard line on inflation on the basis of higher oil prices, so the situation would need a few pieces to fall into place for that scenario to happen, but it does seem as though the pieces are there.
USD/JPY Daily Price Chart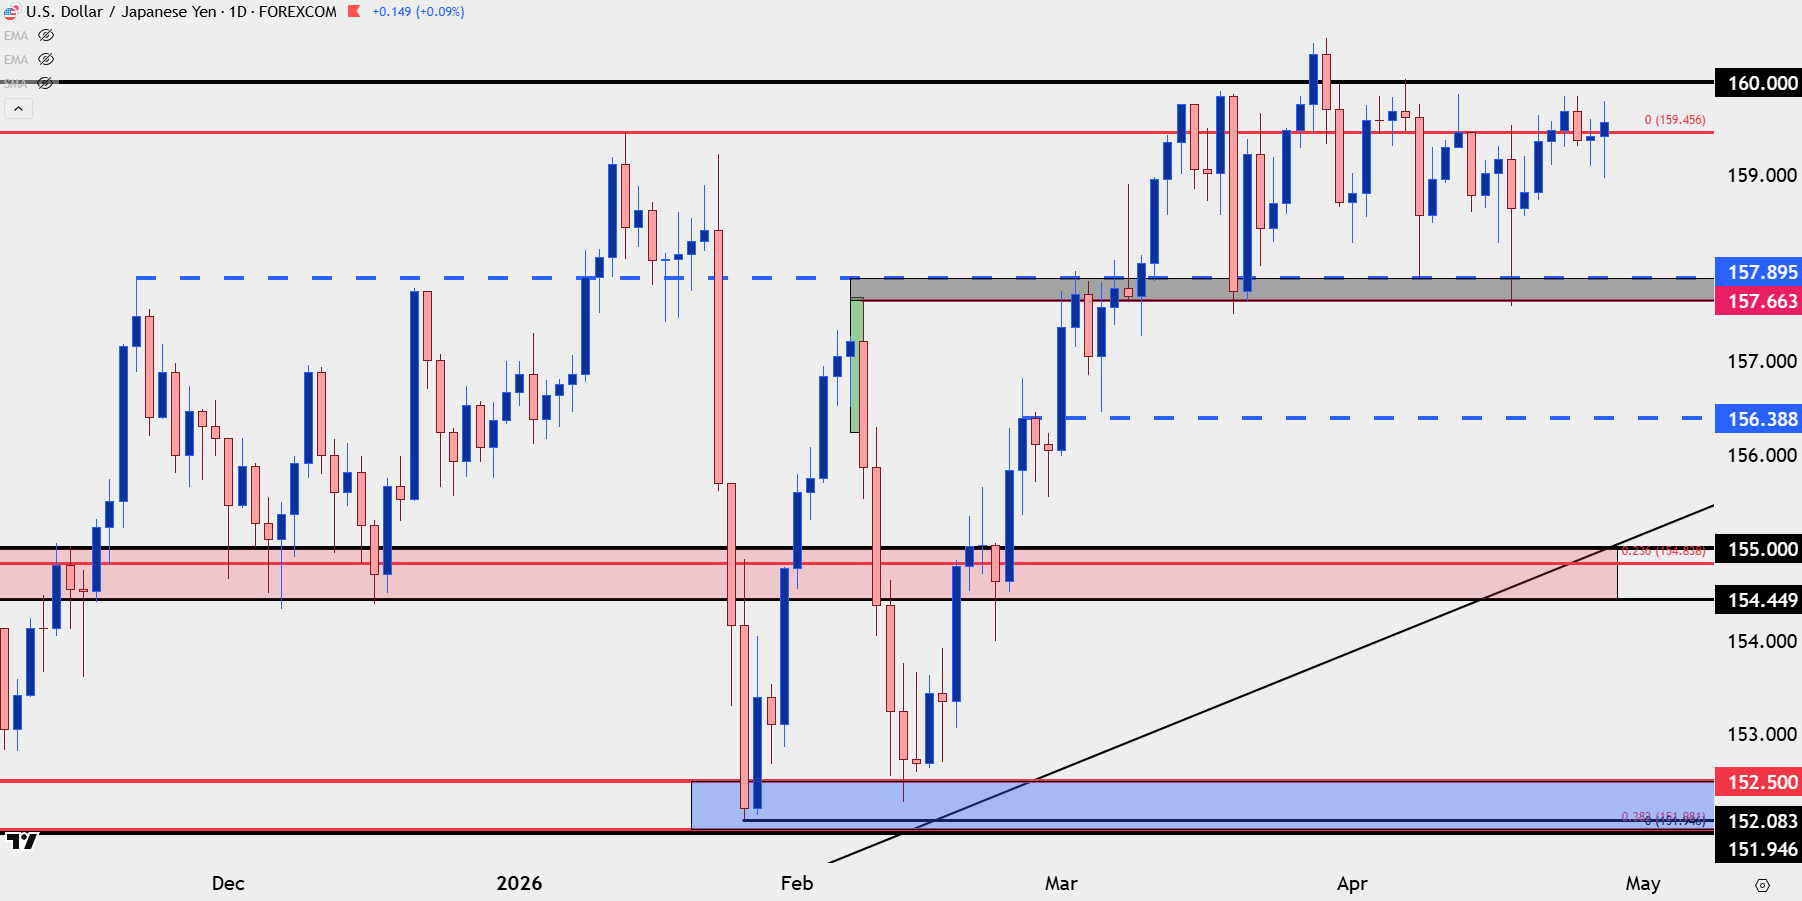
Chart prepared by James Stanley; data derived from Tradingview
Gold
Last but most certainly not least, we have the set up in gold. I’ve been tracking a descending triangle here ever since last week’s rising wedge breakdown. From the rising wedge we had Fibonacci support at 4671, and that level held a few different bounces with lower-highs showing after each until this week’s breakdown took over.
That price is now resistance potential if bulls can force a pullback but before that comes into play we’ve seen some selling at 4600. Near-term, as looked at in the webinar, I think there’s an open door for bulls to push a break of 4600 but overhead resistance then becomes an issue at 4671 or perhaps the bearish trendline that’s guided the lows since last week’s high.
Gold Four-Hour Chart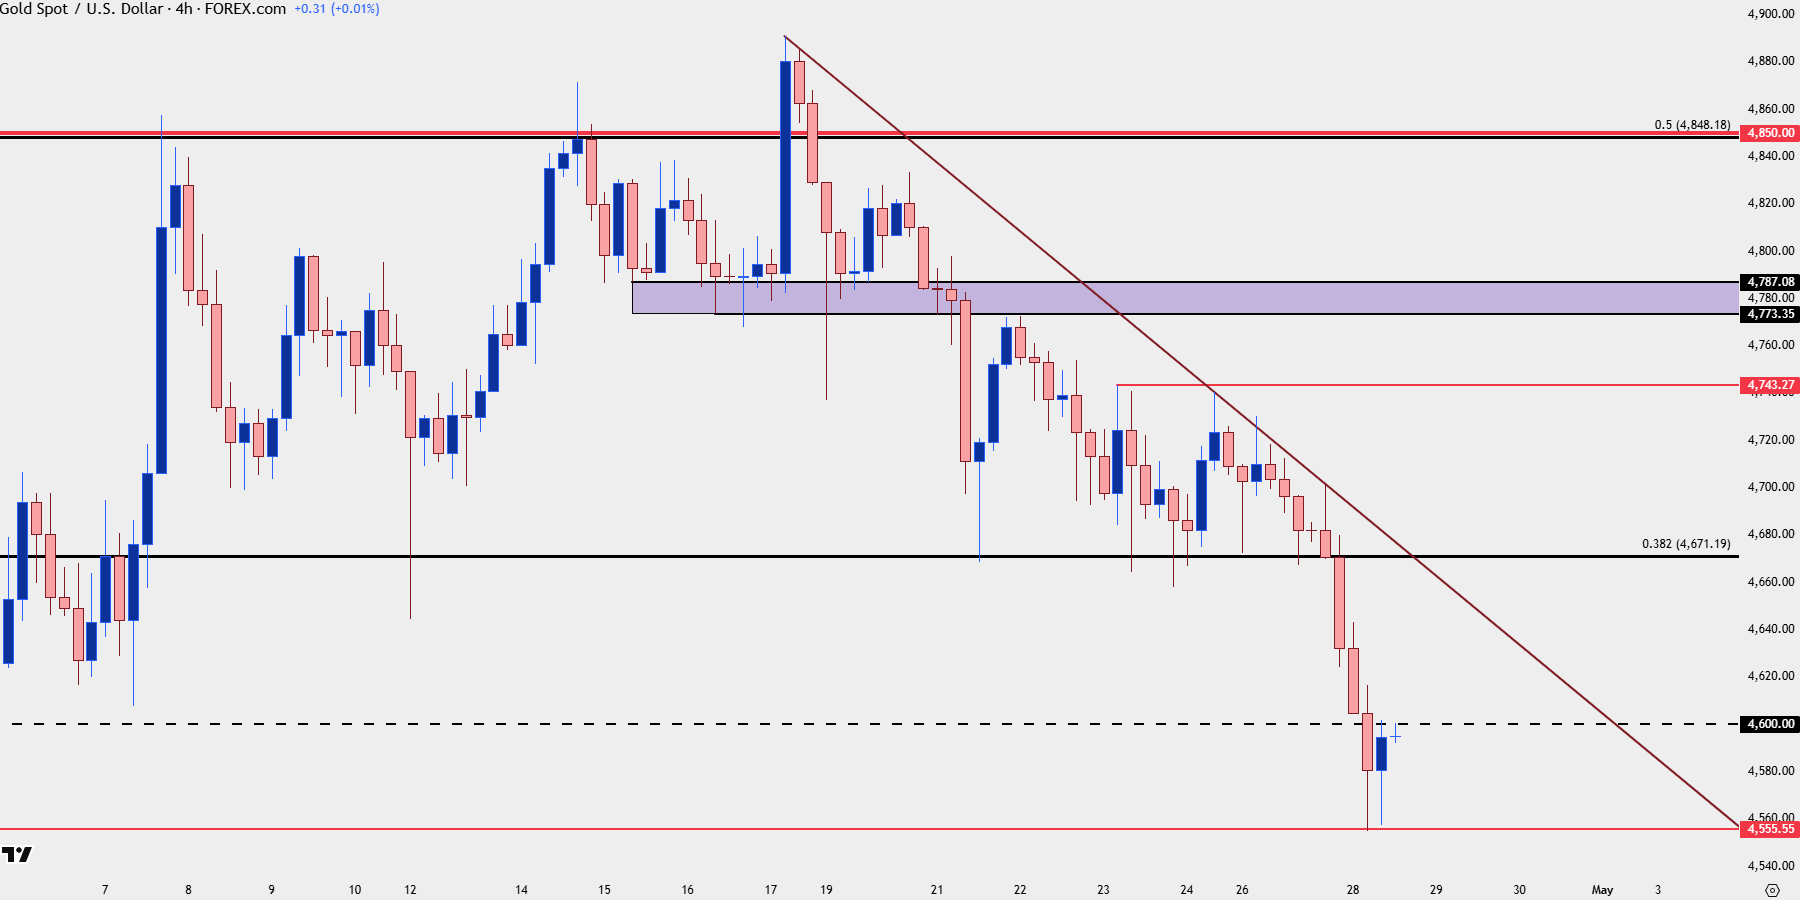
Chart prepared by James Stanley; data derived from Tradingview
--- written by James Stanley, Senior Market Analyst, Global Macro
Latest market news




Open an account in minutes
Experience award-winning platforms with fast and secure execution.
Economic calendar
Web Trader platform
Our sophisticated web-based platform is packed with features.
Related articles
US Dollar Price Action Setups: EUR/USD, USD/JPY, GBP/USD, USD/CAD
In a wide ranging webinar multiple USD pairs were in focus, continuing last week’s rally in DXY as EUR/USD tests 1.1000 and USD/JPY tests the 160.00 level.
EUR/USD outlook: euro back above 1.1000 as dollar rally loses steam
EUR/USD has recovered back above 1.1000 after a brief break lower, a sign the dollar's inflation-driven rally may be losing momentum. With a December Fed hike largely priced in and oil a potential tailwind for the euro, the risks are starting to tilt to the upside.

British Pound Technical Outlook: GBP/USD Tests Pivotal Support—Breakdown Risk Rises 11 17 2026
Sterling bears are pressing critical support near the yearly lows, with the next reaction likely to determine whether the broader trading range survives.

The information on this web site is not targeted at the general public of any particular country. It is not intended for distribution to residents in any country where such distribution or use would contravene any local law or regulatory requirement. The information and opinions in this report are for general information use only and are not intended as an offer or solicitation with respect to the purchase or sale of any currency or CFD contract. All opinions and information contained in this report are subject to change without notice. This report has been prepared without regard to the specific investment objectives, financial situation and needs of any particular recipient. Any references to historical price movements or levels is informational based on our analysis and we do not represent or warranty that any such movements or levels are likely to reoccur in the future. While the information contained herein was obtained from sources believed to be reliable, author does not guarantee its accuracy or completeness, nor does author assume any liability for any direct, indirect or consequential loss that may result from the reliance by any person upon any such information or opinions.
Futures, Options on Futures, Foreign Exchange and other leveraged products involves significant risk of loss and is not suitable for all investors. Losses can exceed your deposits. Increasing leverage increases risk. Spot Gold and Silver contracts are not subject to regulation under the U.S. Commodity Exchange Act. Contracts for Difference (CFDs) are not available for US residents. Before deciding to trade forex, commodity futures, or digital assets, you should carefully consider your financial objectives, level of experience and risk appetite. Any opinions, news, research, analyses, prices or other information contained herein is intended as general information about the subject matter covered and is provided with the understanding that we do not provide any investment, legal, or tax advice. You should consult with appropriate counsel or other advisors on all investment, legal, or tax matters. References to FOREX.com or GAIN Capital refer to StoneX Group Inc. and its subsidiaries. Please read Characteristics and Risks of Standardized Options.