
US Dollar Support Test
The US Dollar continues to test a big spot on the chart as the ‘s1’ level of 99.40 remains in-play after initially coming back into the picture last Friday. The obvious driver on the morning was ADP data, which is perhaps seeing even more focus given the ongoing government shutdown and the lack of NFP reports. But that government shutdown may soon be coming to an end and we can see stocks jumping on the back of that news, with the Senate already having approved a resolution and now we’re just waiting on the House.
In the webinar, I looked at the USD from multiple angles, with EUR/USD, GBP/USD, USD/JPY and USD/CAD all front-and-center for strategy around DXY.
USD
In DXY, last week saw the Dollar testing a massive spot of resistance and a day later, the currency set fresh four-month high. But, that’s where the music stopped as a doji on Wednesday was followed by sell-off on Thursday, completing an evening star pattern that’s so far led to continuation.
But we’re now where the rubber meets the road as ‘s1’ support of 99.40 – the same resistance that held the highs a month ago – is now in-play. Below that, the 98.98 Fibonacci level looms large after which prior resistance-turned-support sits at 98.60.
US Dollar Daily Chart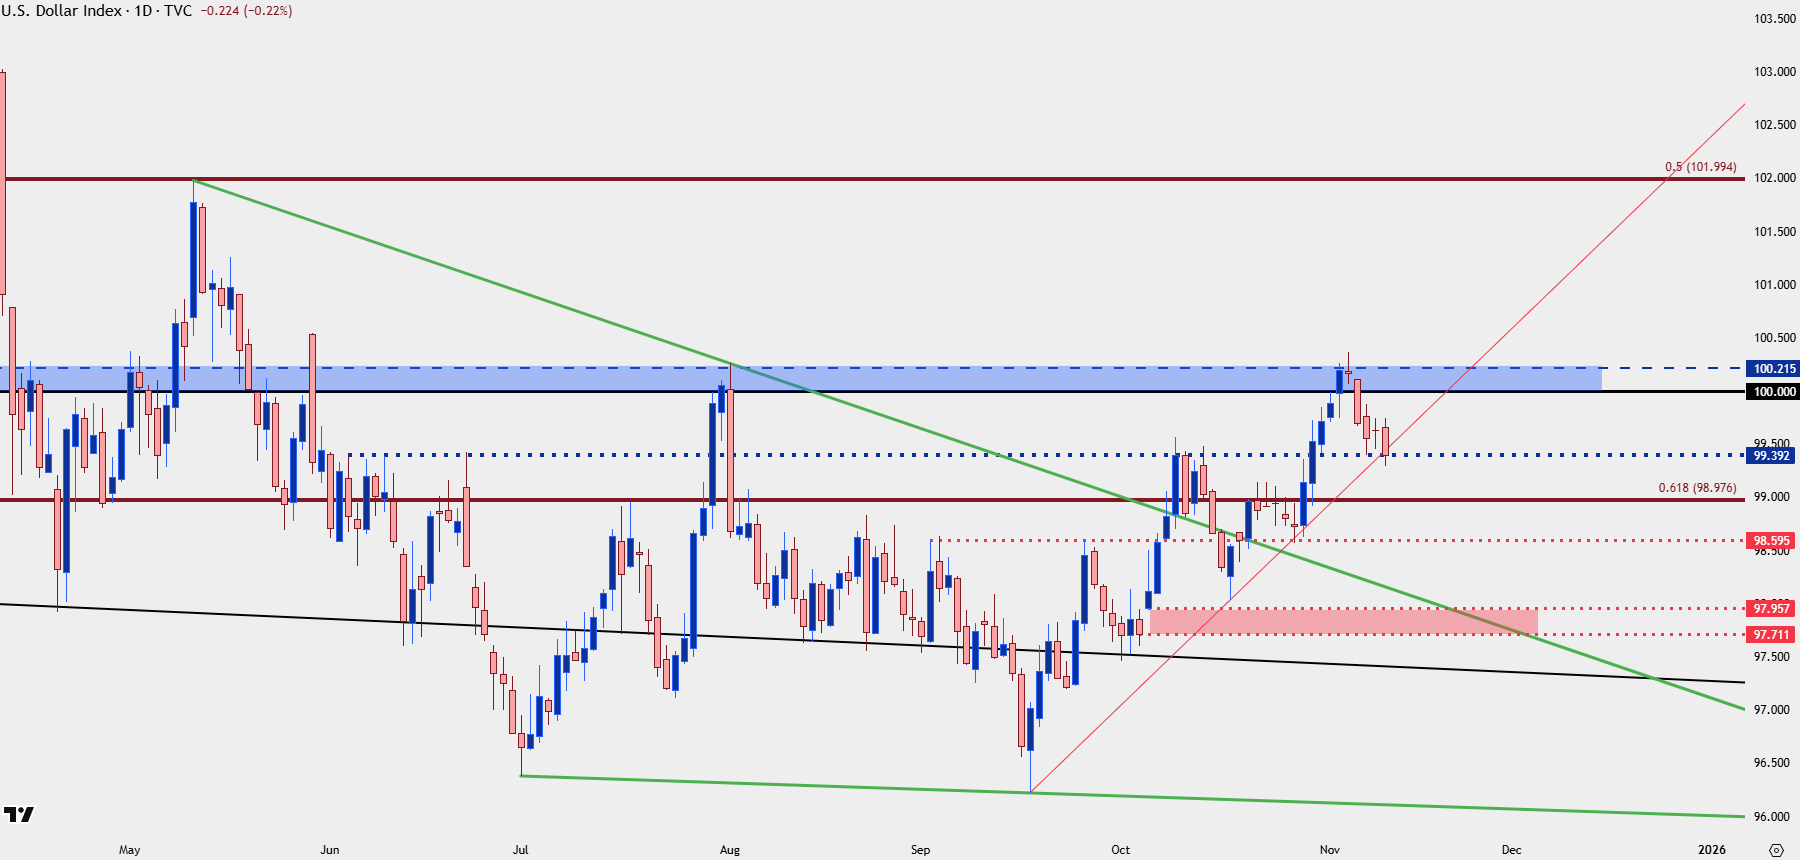
Chart prepared by James Stanley; data derived from Tradingview
EUR/USD
EUR/USD is also at a big spot and a level looked at in last week’s webinar, with 1.1593 currently holding the high.
I warned last week of chasing below 1.1500 as that psychological level has had a big pull on price action even going back to the 2015-2017 episode. Sellers suddenly dried up below that price last week and that’s led to a snap back move, and now that prices are testing lower-high resistance, the question is how aggressive bears will remain to be.
Above current resistance is another zone of importance from 1.1631-1.1646, and then there’s the Fibonacci level at 1.1686.

Shorter-term, strength is justifiable given the higher-low support that’s so far shown at 1.1543; and if looking for USD-strength, I think there’s more amenable pastures in USD/JPY and possibly even USD/CAD, so for now, I’m setting up EUR/USD for USD-weakness scenarios until that shorter-term bullish structure can be nullified.
EUR/USD Four-Hour Chart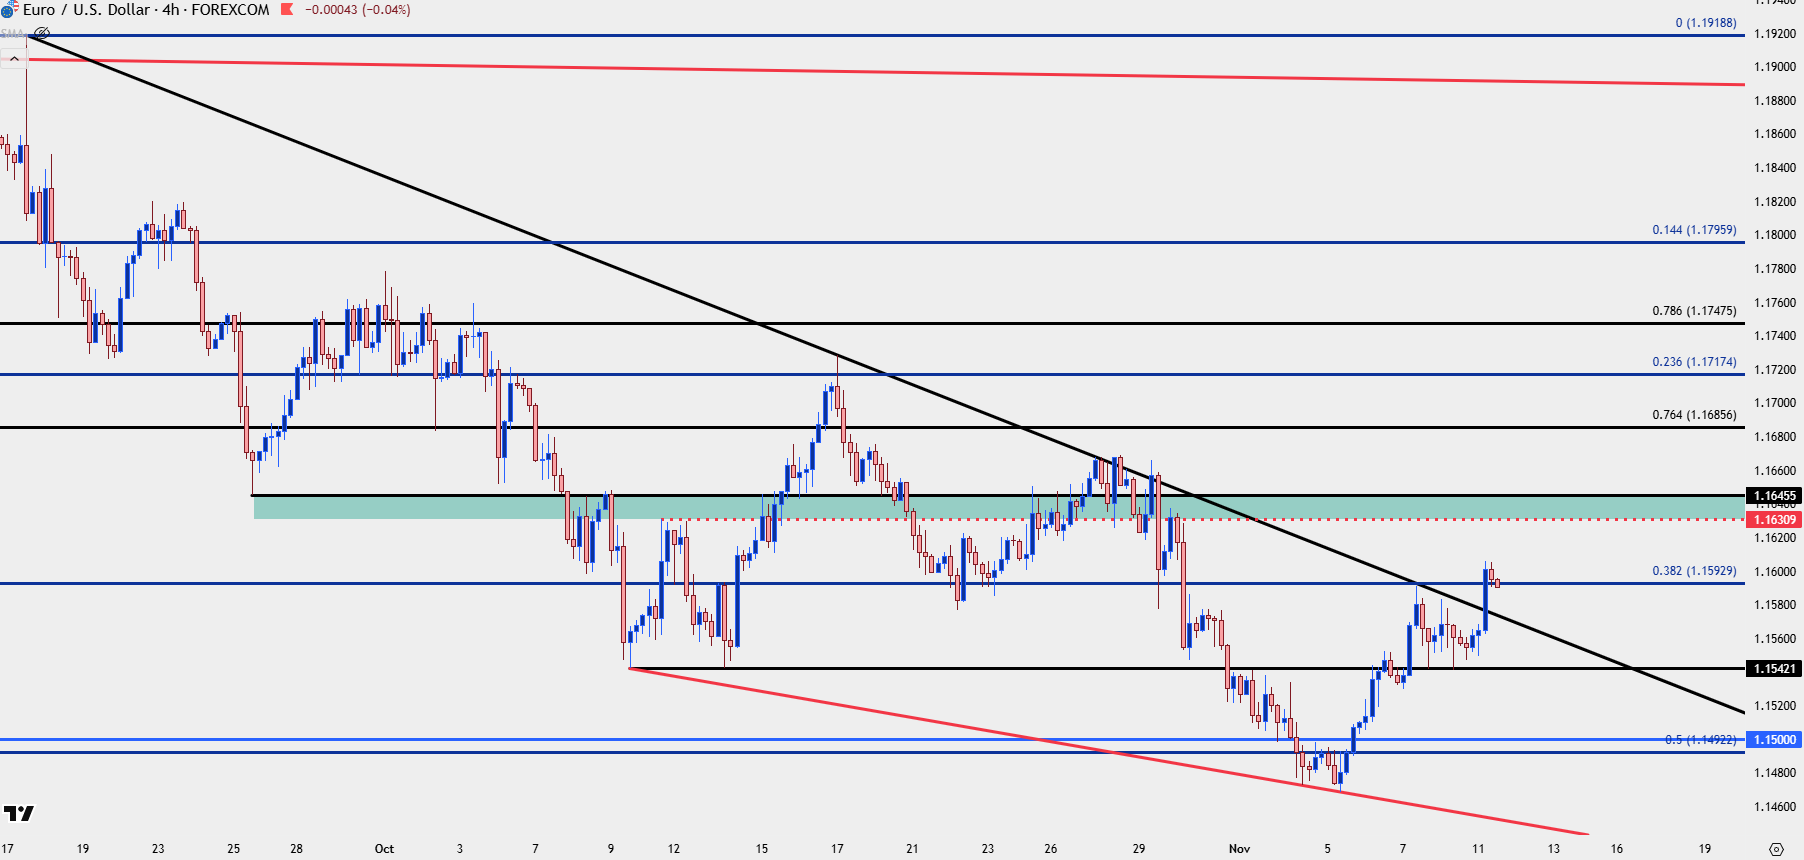
Chart prepared by James Stanley; data derived from Tradingview
GBP/USD
Cable was beaten up pretty badly when we looked at it last week, and daily RSI was at it’s lowest in more than two years. The pair was also stalling before a 1.3000 test and like I wrote last week, that can open the door for pullbacks that are essentially short-term reversal backdrops.
That has since played out with the pair rallying with a series of higher-highs and lows, and I want to keep this in the bearish USD camp for now. There’s a support zone from 1.3097-1.3017 that I want to see hold to keep the door open for topside, and ideally, buyers would show up before a test of that with the 1.3140 level carrying a big of importance.
GBP/USD Four-Hour Chart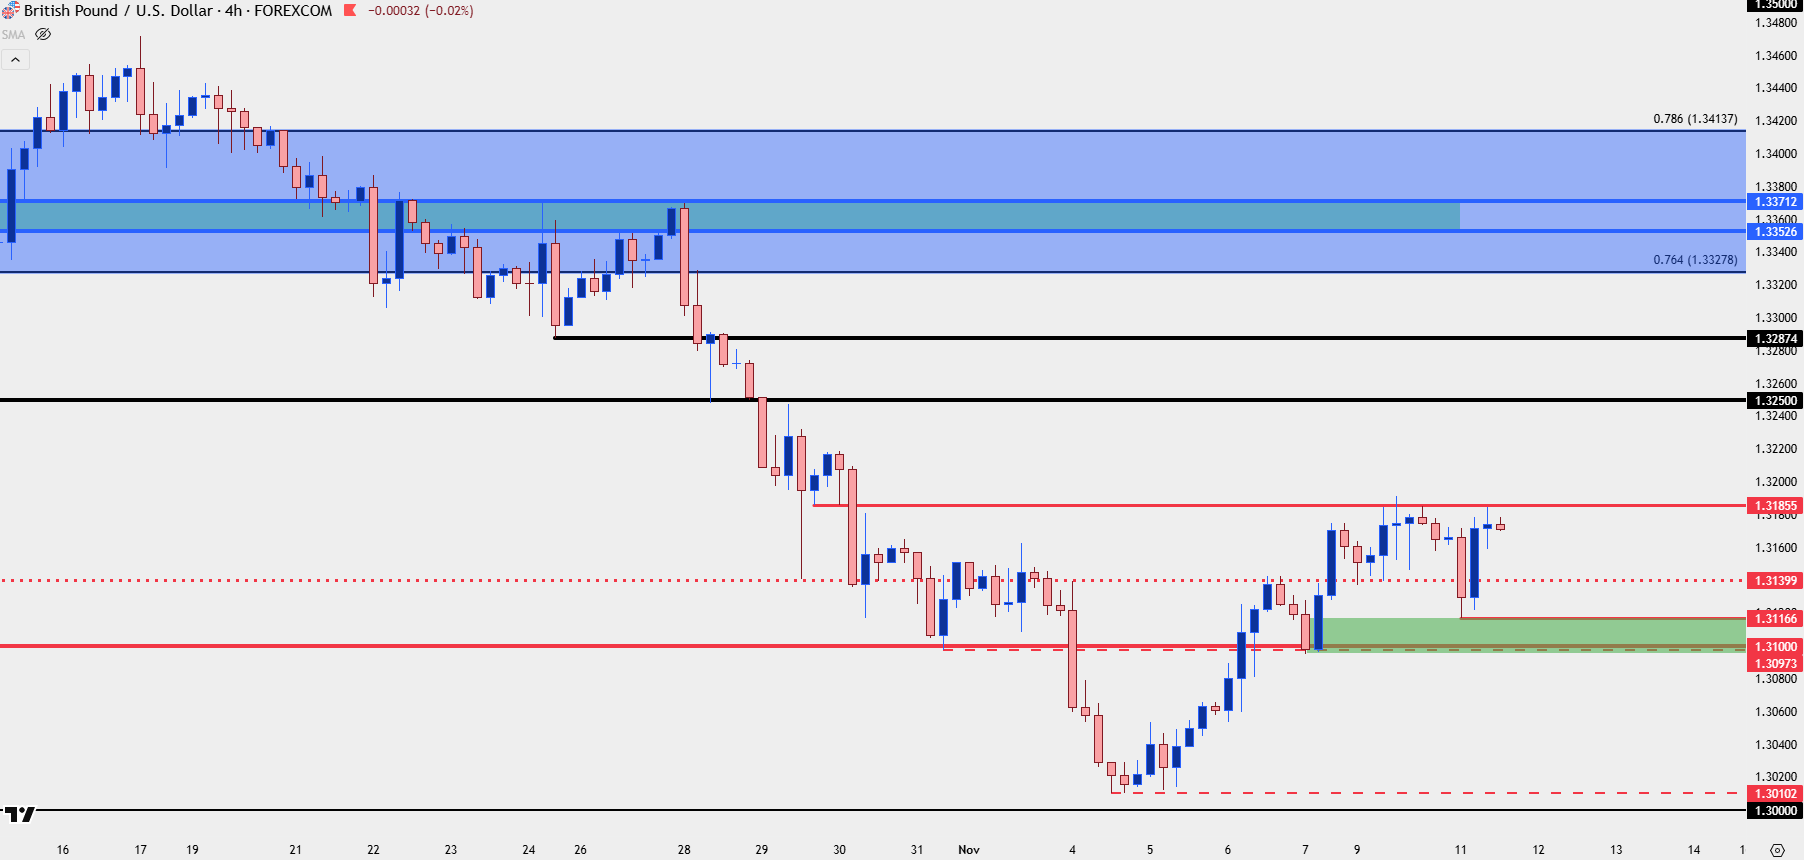
Chart prepared by James Stanley; data derived from Tradingview
USD/JPY
USD/JPY is still my favored pair for USD-strength, and as a case in point, even with DXY drawing back for a support test, USD/JPY sits near recently establish nine-month highs.
The challenge at this point is the 155.00 level, and shorter-term, it’s the Fibonacci level at 154.33 that’s so far held another item of resistance. With the 155.00 level there’s fear of intervention, or at least threats of intervention from the Japanese Ministry of Finance. But I talked about this in the webinar where that’s a saga that usually takes time and a decisive show of Yen-weakness before it plays out.
Yen-weakness can also be set up against the Euro or British Pound and I showed setups for each in the above video.
For USD/JPY, I have short-term supports at 153.63, 153.28 and 152.83-152.96.

USD/JPY Daily Price Chart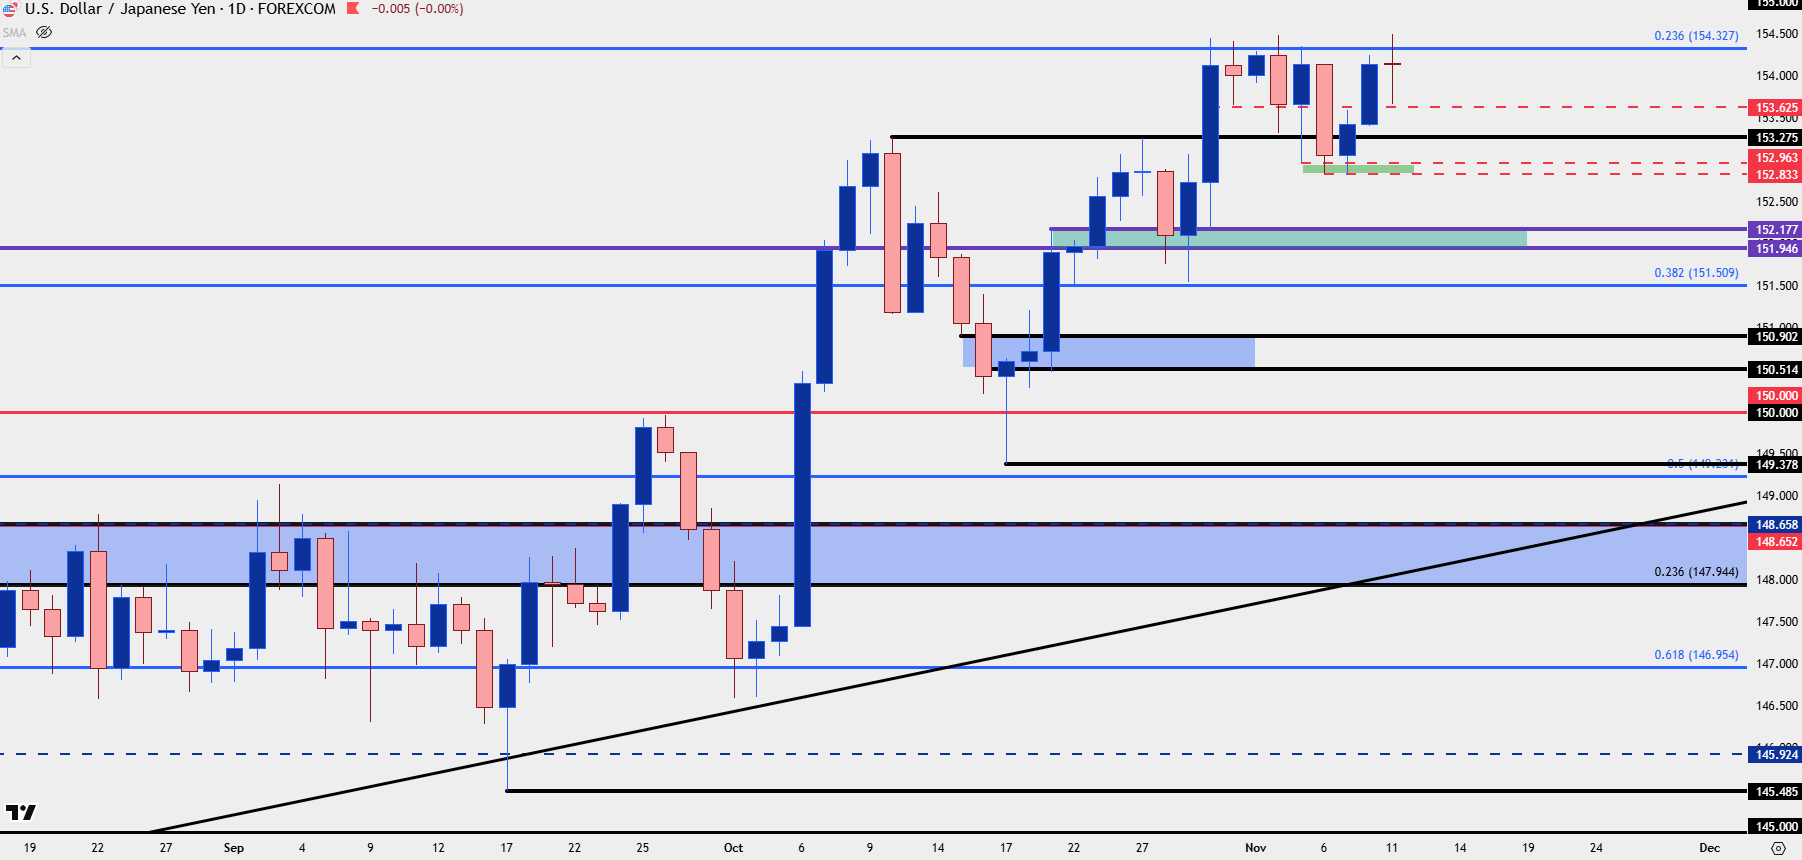
Chart prepared by James Stanley; data derived from Tradingview
USD/CAD
USD/CAD is also in the bullish USD camp although the setup here is a bit less attractive than the above in USD/JPY. In USD/CAD, it’s the 1.4000 level that’s already in-play and that zone syncs down to 1.3981.
USD/CAD Daily Chart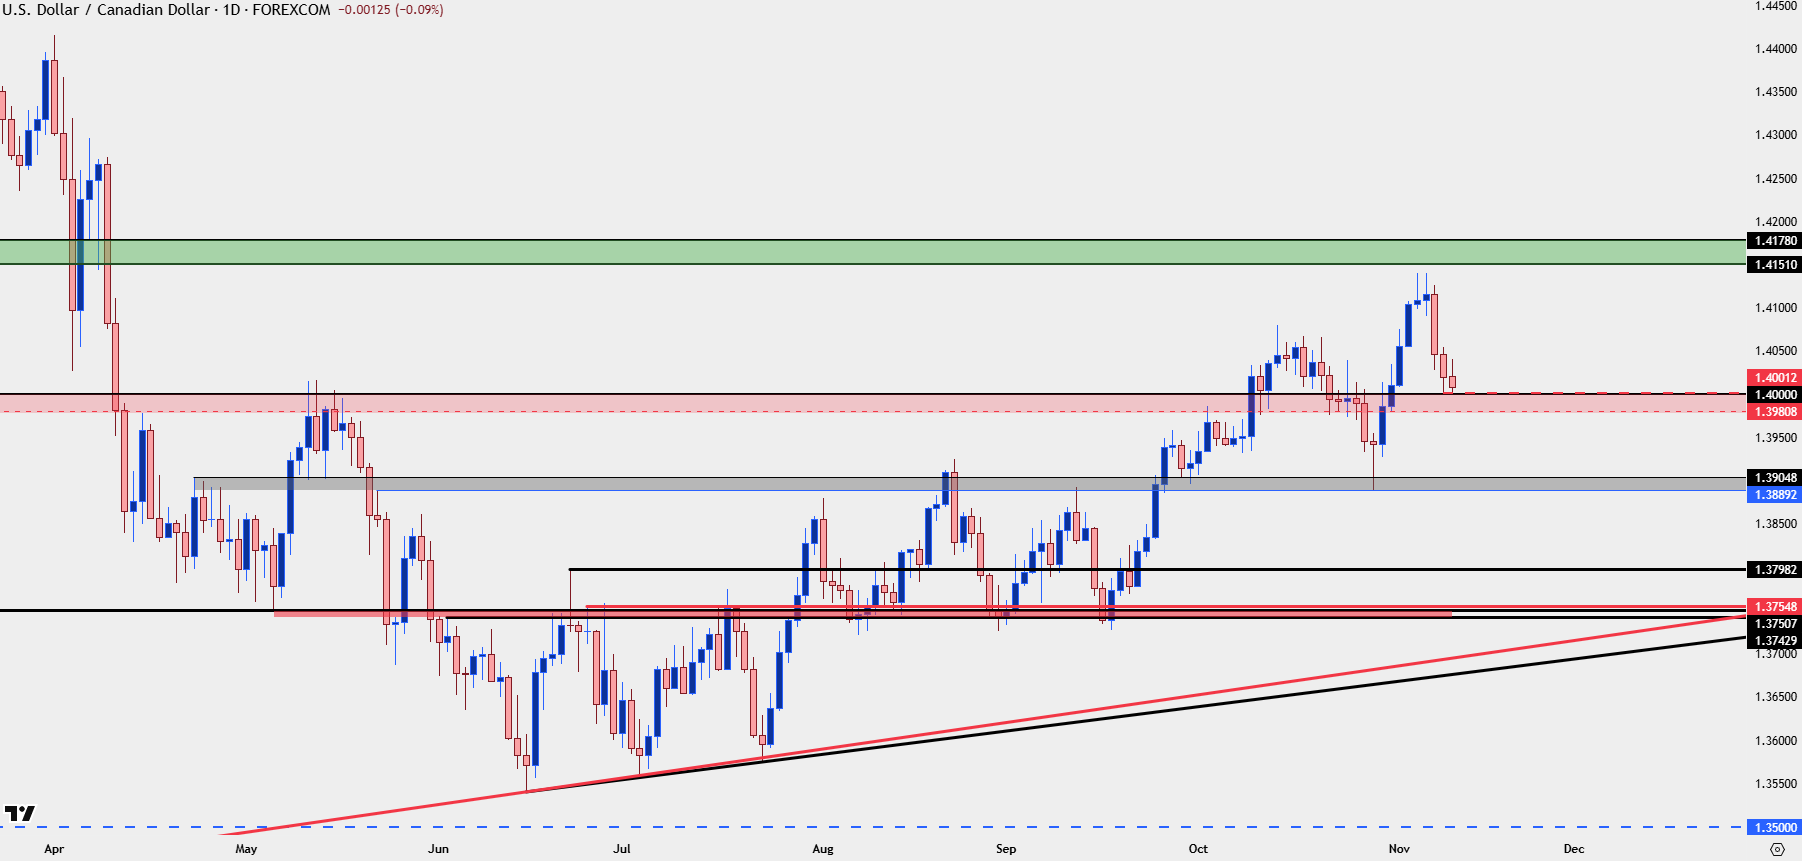
Chart prepared by James Stanley; data derived from Tradingview
--- written by James Stanley, Senior Market Analyst, Global Macro