
US Dollar Talking Points:
- It was a big week for US data and, initially, stronger-than-expected inflation led to a sizable ramp in the Greenback. But shortly after that CPI release prices began to pullback and that continued into the weekly close, allowing for the build of a bearish engulfing candlestick on the weekly chart.
- The 101.80 level continues to loom large in the DXY basket and, as usual, picking spots is important as USD-weakness showed well in GBP/USD while USD strength remains more attractive in USD/JPY and perhaps even USD/CAD. All are setups looked at in the Tuesday webinar and updated below.
When the fundamental backdrop diverges from price action, we have a possible turn, and that’s what the past week has been for the US Dollar. While inflation remains high in the US and the Fed is on track to hike rates again by the end of the year, the US Dollar sold off and put in a bearish engulfing candlestick on the weekly chart even despite strong CPI and PPI prints.
To be sure, there’s more to it as the Dollar came into the week overbought and showing signs of exhaustion, fueled by a stringent sell-off in the Euro. But, as we go into the next week the shadow of that bearish engulf remains prominent.
For levels, it’s the 101.80 level that stands out as support as the long-term Fibonacci level had previously held resistance back in June; and for the past two weeks that price has kept bears at bay.
US Dollar Weekly Price Chart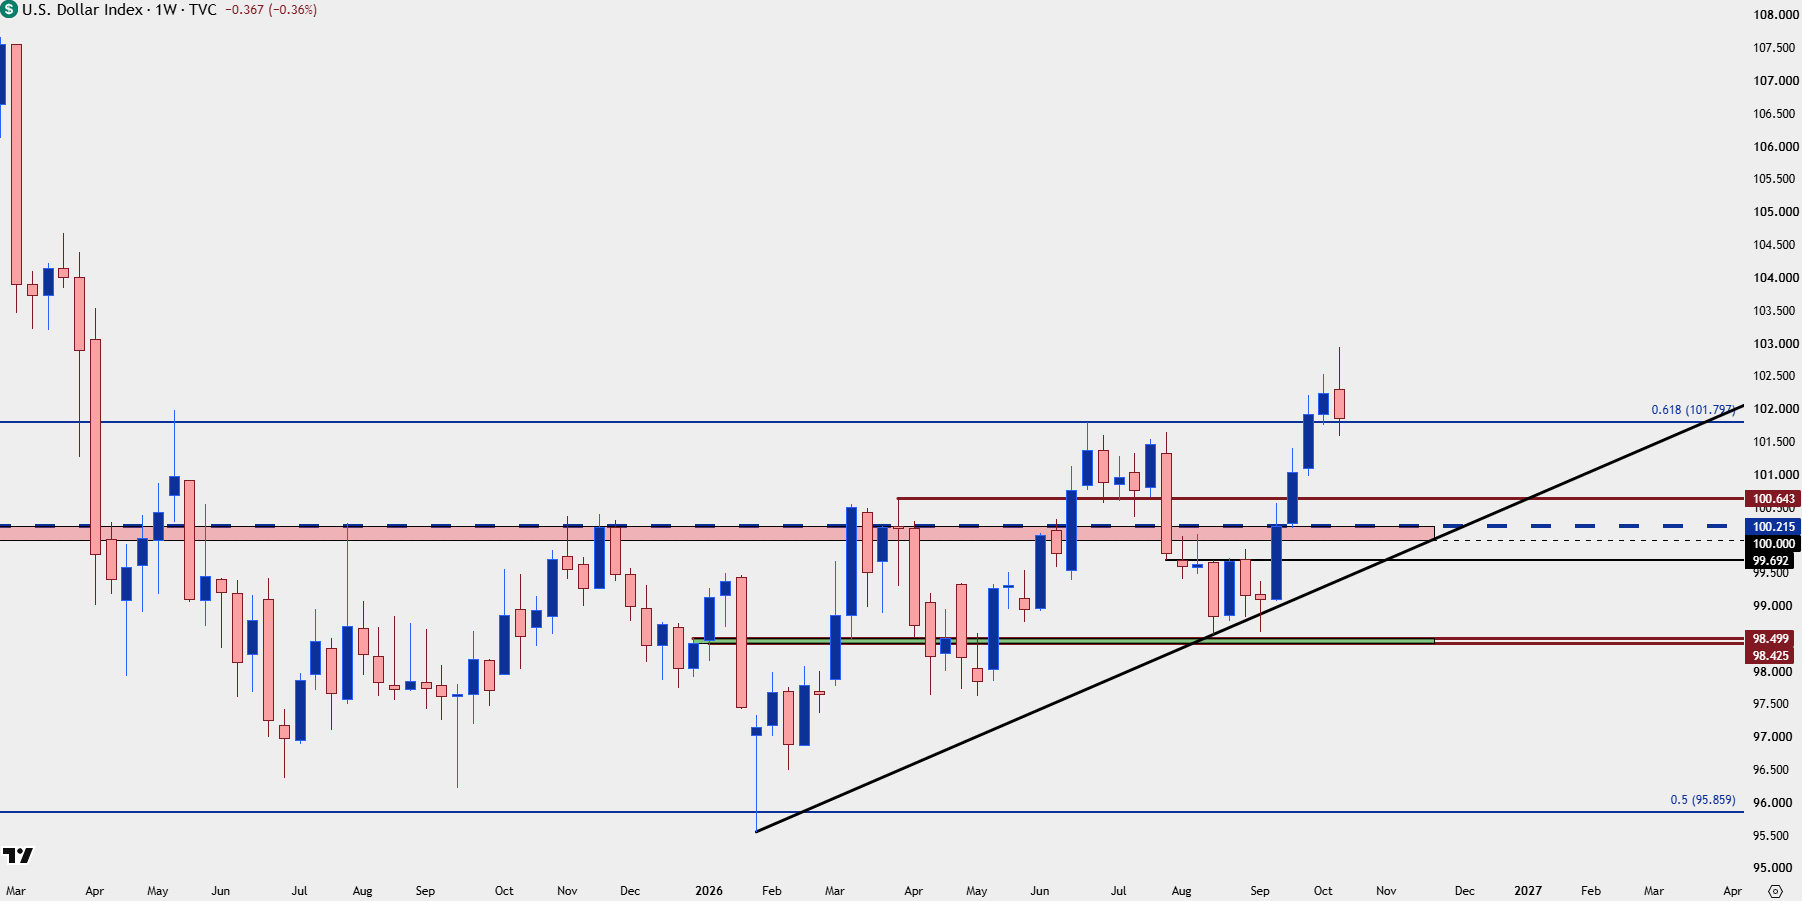
Chart prepared by James Stanley; data derived from Tradingview
EUR/USD
The big push point for the USD rally of late has been the continued sell-off in the Euro, with EUR/USD going oversold as DXY went overbought. And while the engulfing pattern of the above setup wasn’t quite mirrored in EUR/USD, there was a glimmer of hope that had started to show as the pair put in its first green week since the September open.
EUR/USD Weekly Chart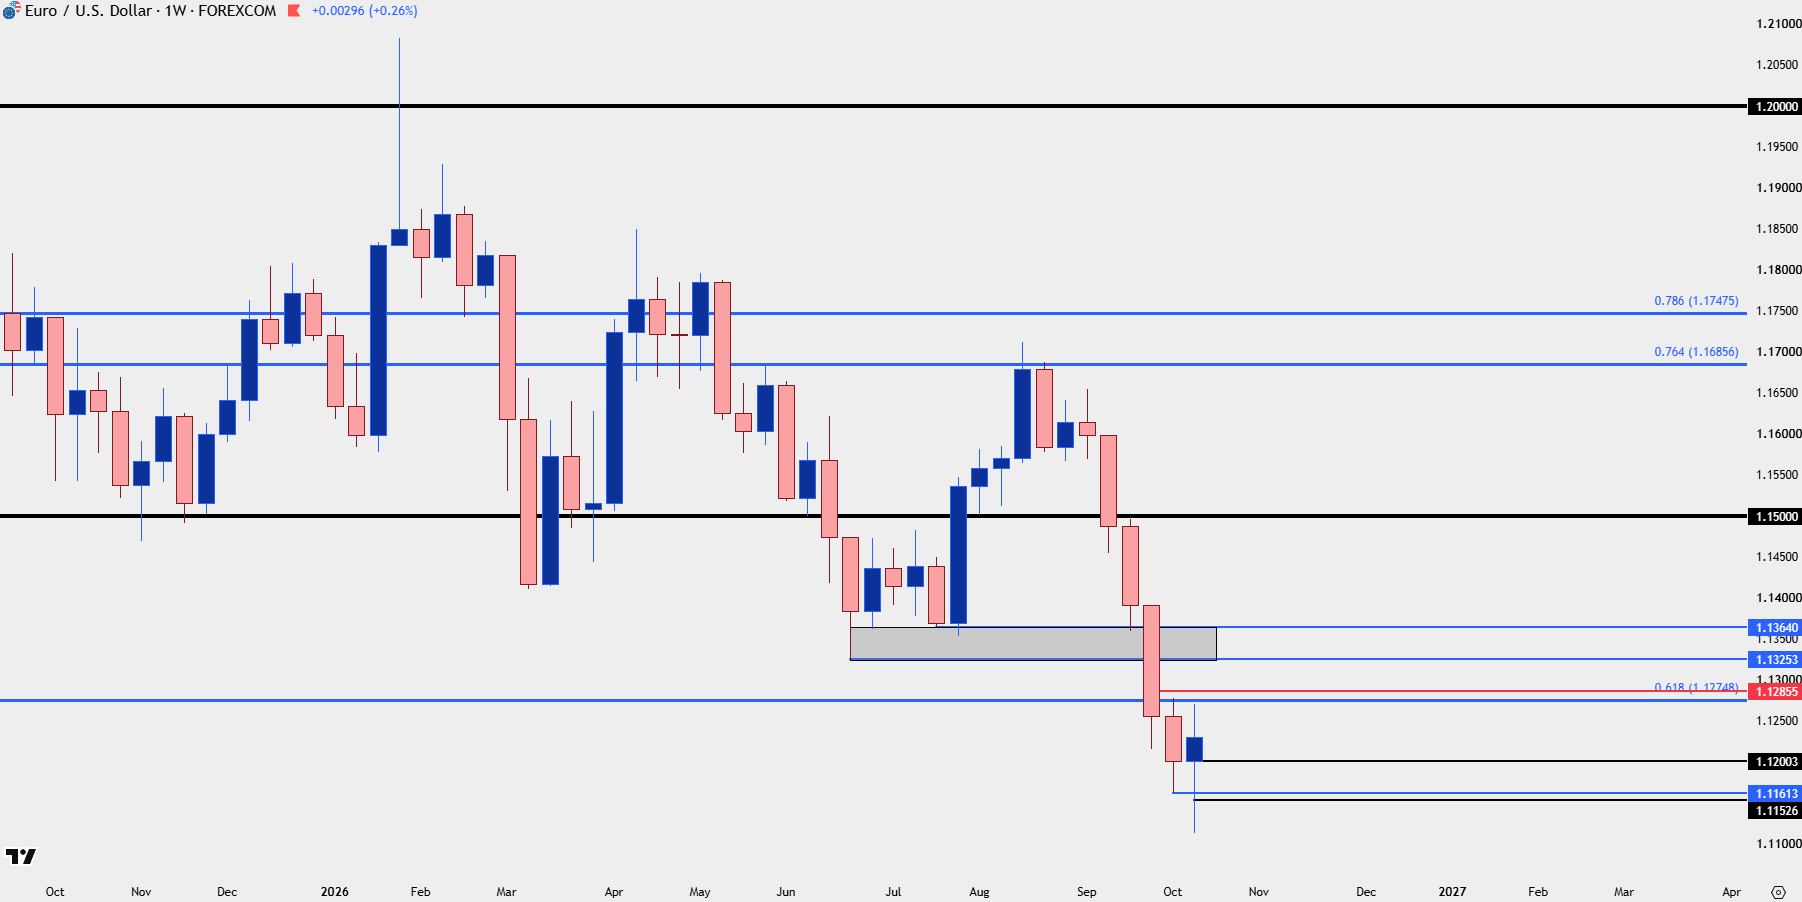
Chart prepared by James Stanley; data derived from Tradingview
EUR/USD Daily
The Euro is 57.6% of the DXY basket so there’s probably some intertwined fates between the two markets at this point, and while bulls did pullback in late-week trade which takes some of the shine off of the move, there is a case for capitulation, as looked at in the Tuesday webinar. The extended underside wick from the Wednesday candle led to a rally and fresh short-term higher-high, and this highlights the 1.1200 level as key support into early trade next week. And overhead, it’s the zone from 1.1275-1.1285 that looms large.
EUR/USD Daily Chart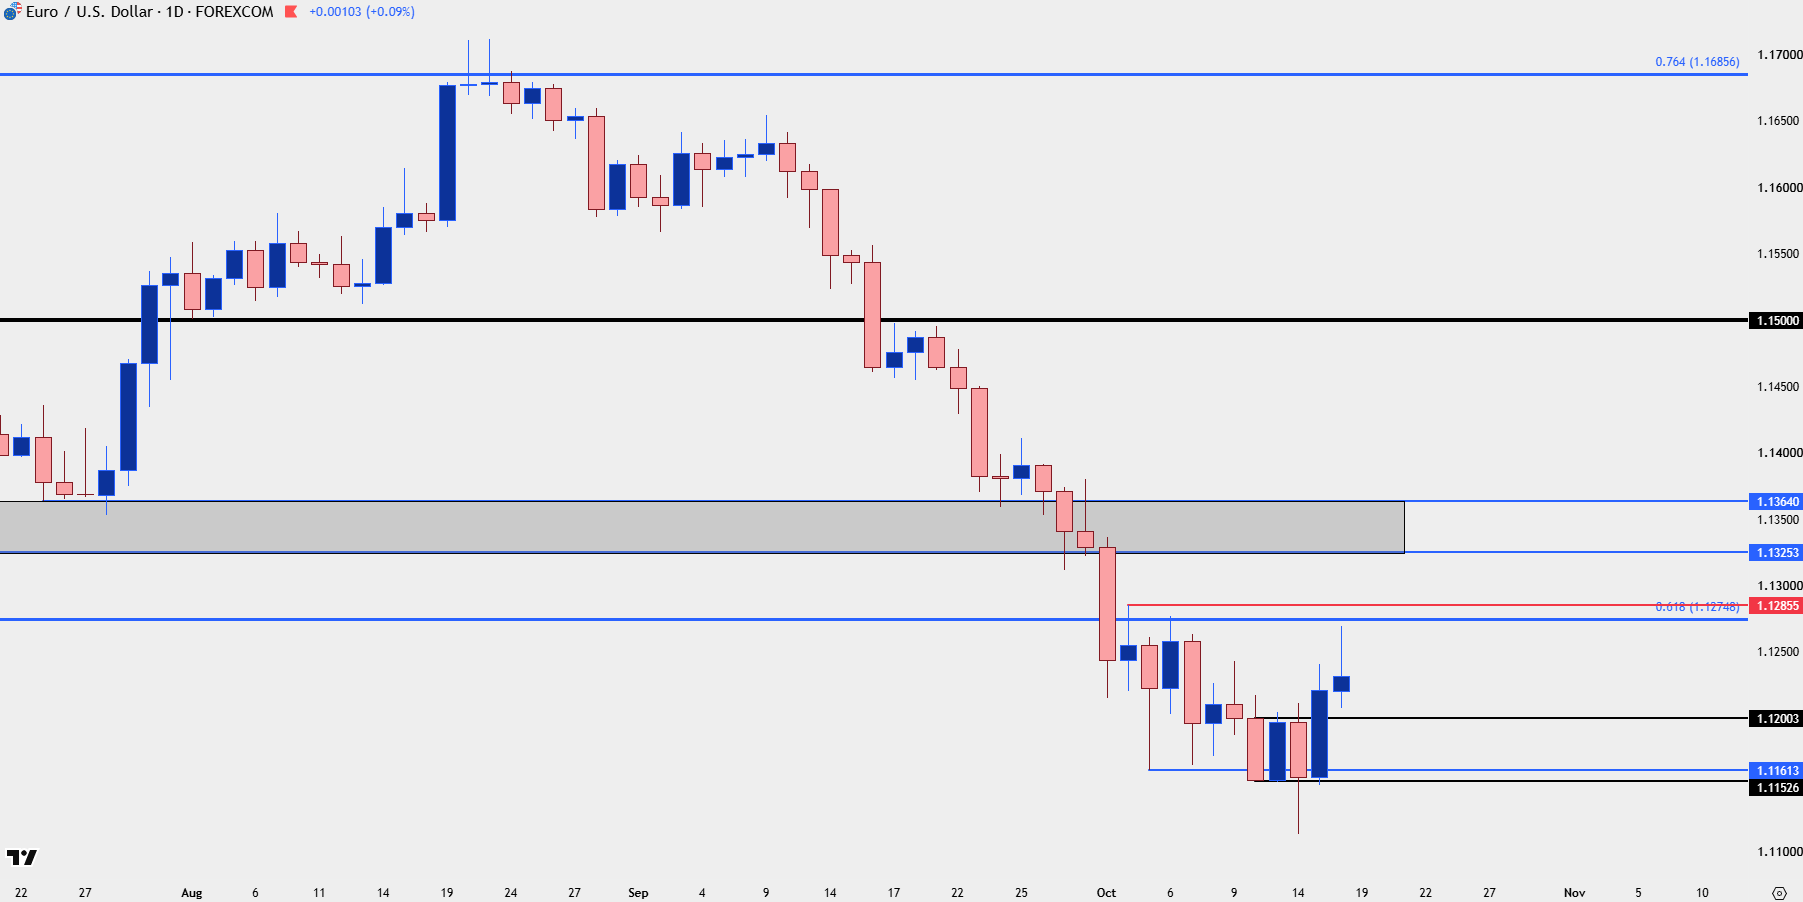
Chart prepared by James Stanley; data derived from Tradingview
GBP/USD
For USD-weakness, I still prefer GBP/USD and the weekly contrast below illustrates why. While EUR/USD printed an indecisive candle (albeit green) GBP/USD showed greater strength following two prior weeks of indecision.
And the low on Thursday printed at a huge spot – the 38.2% Fibonacci retracement of the 2025 rally, a level that had also caught support back in June.
The 23.6% retracement of that move is the next resistance level up, plotted at 1.3390 and, above that, I’m tracking a swing at 1.3451 and then the 1.3500 psychological level.
GBP/USD Weekly Price Chart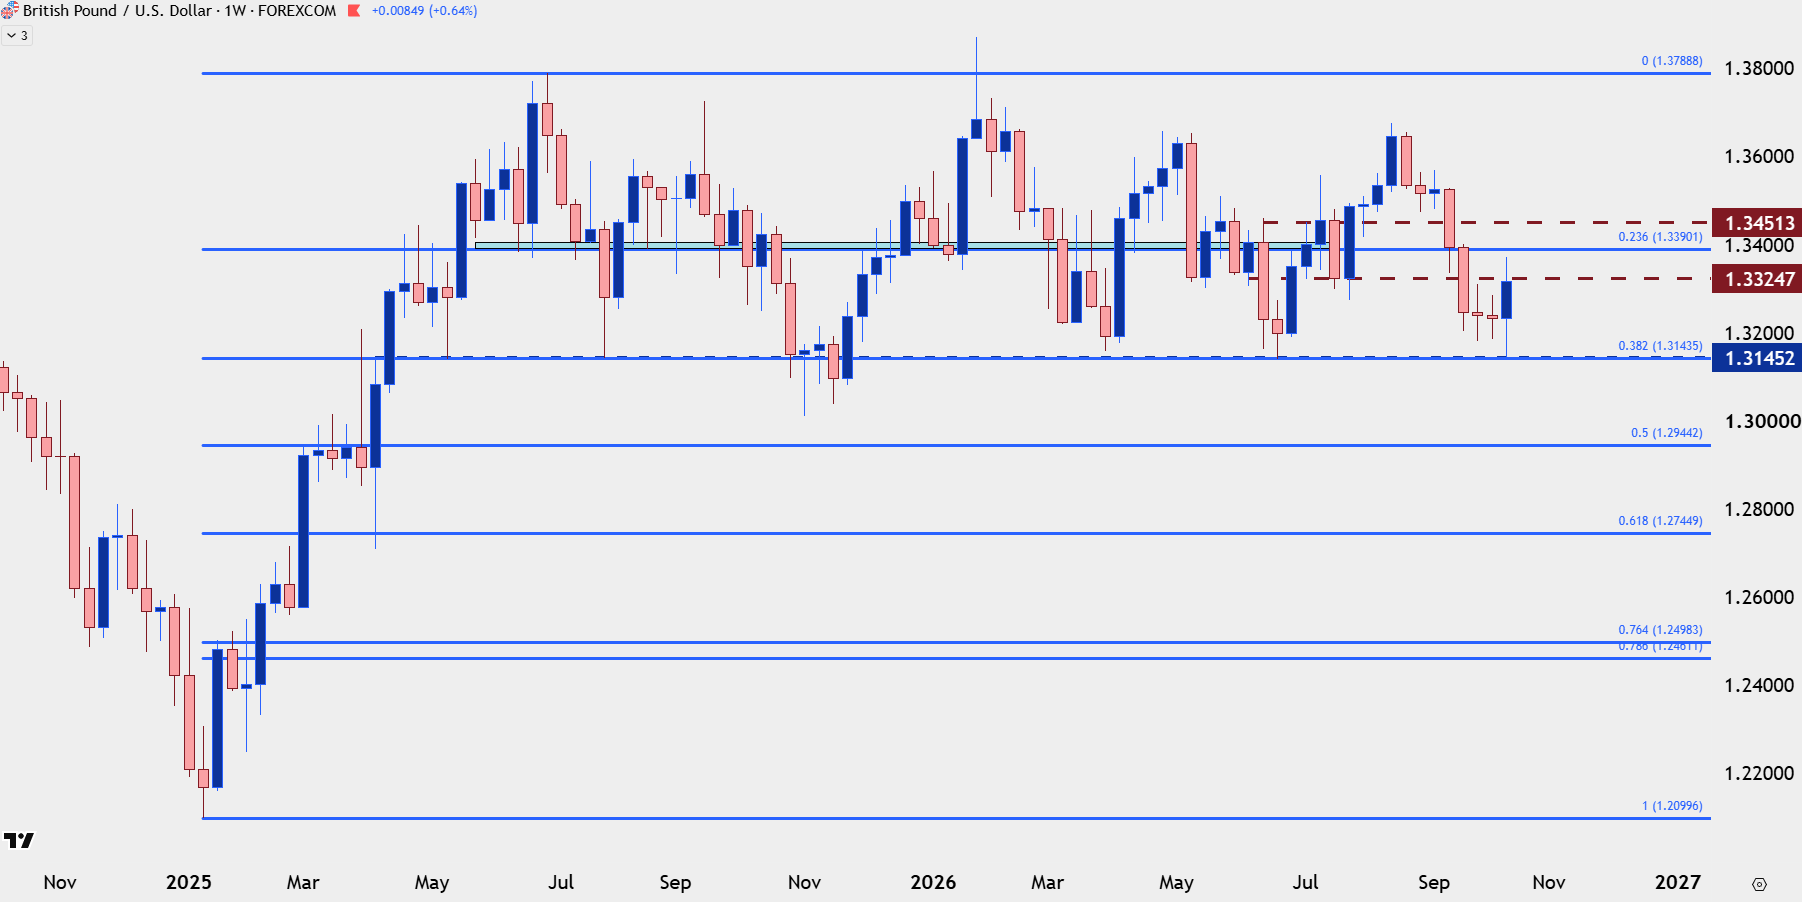
Chart prepared by James Stanley; data derived from Tradingview
USD/JPY
On the other hand, for USD-strength, I still prefer USD/JPY, which retains bullish structure on the daily chart even despite that bearish engulf in the DXY weekly.
This is a market that’s difficult to chase at fresh highs and we saw another example of bulls pulling back before a breakout as price re-approached the 159.00 level. The pullback, so far, has remained rather moderate as support hits can remain attractive especially given the still-positive carry on the long side of the pair.
For next week, I’m tracking supports at 157.50 and the 156.68-157.22 zone, and if we do see the USD sell-off deepen, the next look is for re-test of the familiar 155.00 zone.
USD/JPY Daily Chart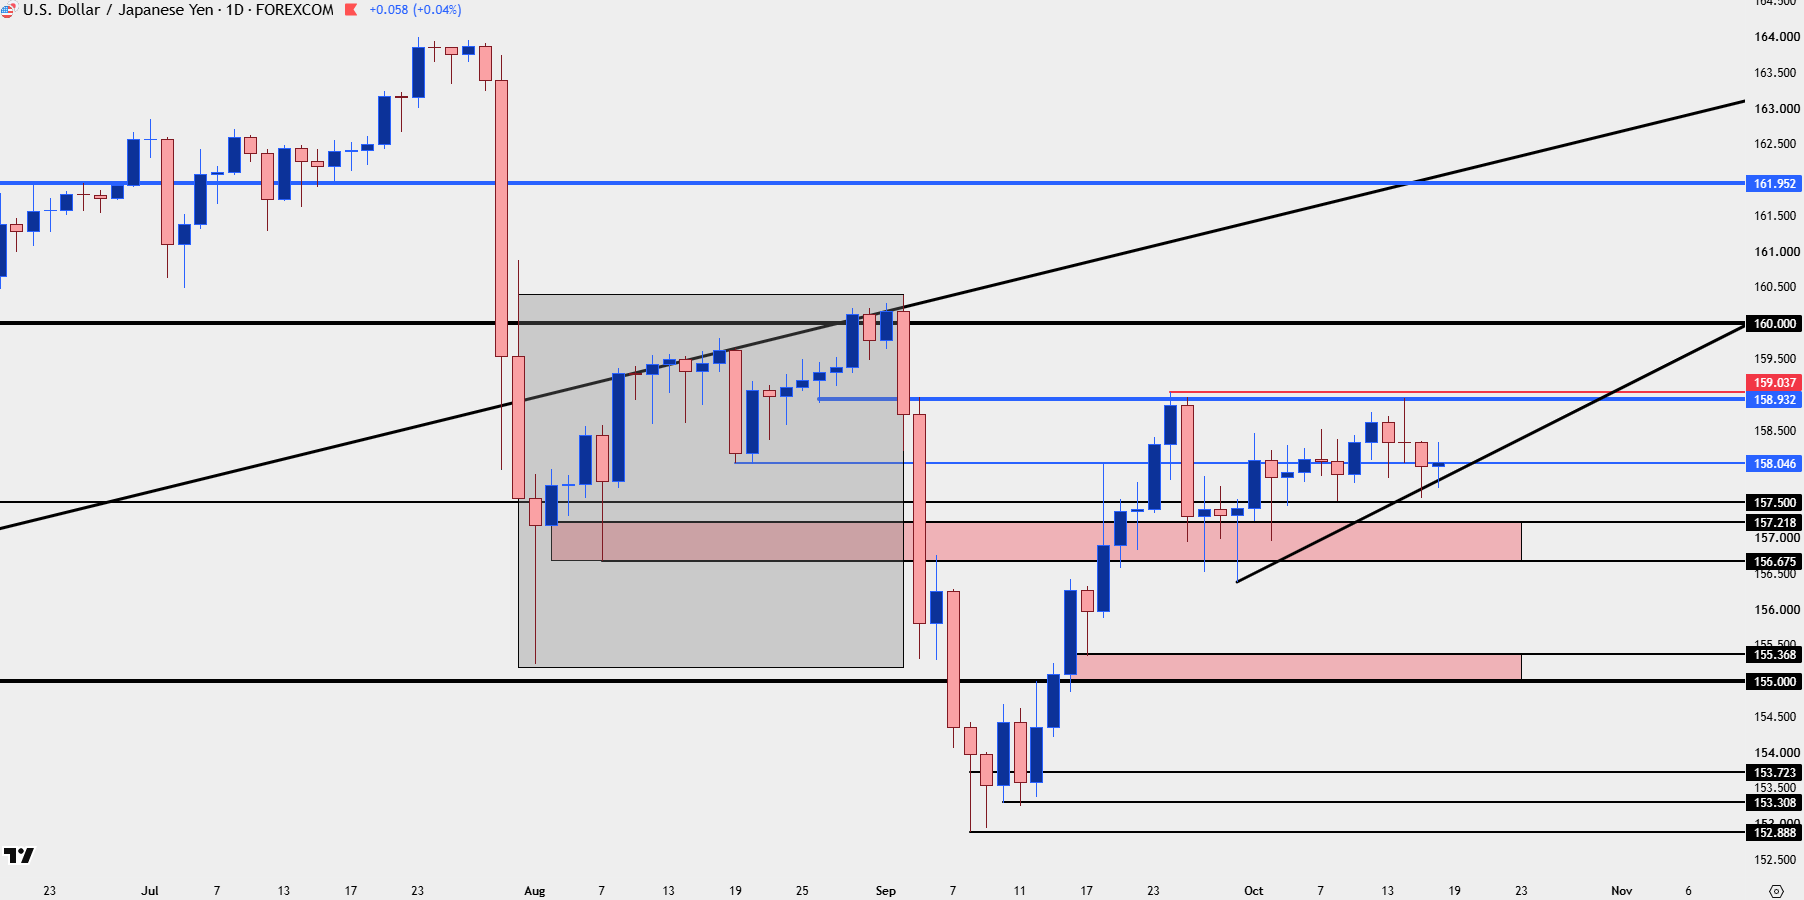
Chart prepared by James Stanley; data derived from Tradingview
--- written by James Stanley, Senior Market Analyst, Global Macro