
As the second week of February comes to a close, the cryptocurrency market has gone through one of its worst periods in recent months. A dominant bearish bias has firmly taken hold, and throughout the week none of the major cryptocurrencies managed to avoid losses exceeding 11%, intensifying the loss of confidence and the lack of short-term appetite. As long as this risk perception fails to show clear signs of reversal, selling pressure is likely to continue dominating price action in the sessions ahead.

Performance of major cryptocurrencies
Source: Data - StoneX, Tradingview
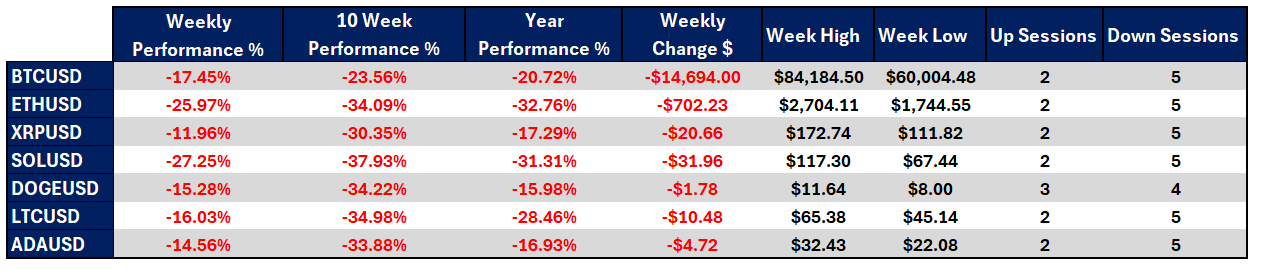
- The most affected cryptocurrency of the week was once again Solana, which posted a decline of -27.25%, showing significantly greater weakness compared to the rest of the market. In contrast, the cryptocurrency that best resisted the bearish bias was Ripple, with a loss of -11.96%. Even so, the broader market continues to display meaningful selling pressure.
- Looking at performance over the past ten weeks, the crypto market remains well below the levels seen at the end of 2025, maintaining a dominant bearish bias. During this period, Solana once again stands out as the most affected asset, with a -37.93% decline, highlighting its high sensitivity to downside moves. Bitcoin, as the benchmark asset, has fallen -23.56%, a smaller decline relative to the broader market, confirming its greater ability to absorb volatility over the medium term.
- As the year progresses, all major cryptocurrencies trade below their annual opening prices. In this environment, Ethereum ranks among the most affected, down -32.76%, while Dogecoin shows relatively better performance, with a decline of -15.98%, below the market average.
- As the market’s primary reference, Bitcoin has lost nearly $15,000 from recent levels and briefly touched the $60,000 area, levels not consistently seen since October 2024. This move complicates any near-term attempt to recover toward areas above $100,000 per BTC.
- Overall, the week has been clearly negative for the crypto market and reflects a continued deterioration in confidence. Although some cryptocurrencies attempted modest recoveries toward the weekly close, these moves remain insufficient to neutralize the prevailing bearish bias.
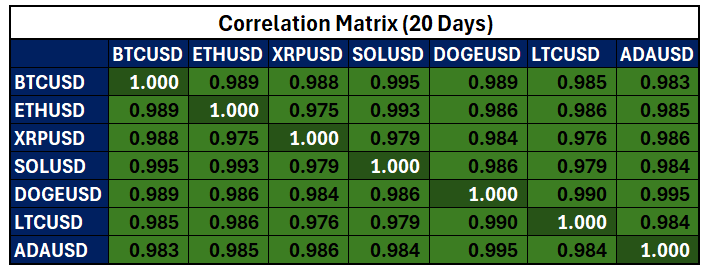
Colors from red to green – red indicates negative correlations and green positive correlations
Source: Data - StoneX, Tradingview
From a correlation perspective, major cryptocurrencies have once again shown elevated correlation coefficients relative to Bitcoin, with values above 0.9, both versus BTC and among themselves. This indicates that the market is reacting in a highly synchronized manner, reflecting broad-based loss of confidence rather than isolated moves in individual assets. It is important to note that correlation coefficients can change over time.
This behavior suggests that the crypto market has realigned, not to sustain a positive bias, but rather to extend a shared phase of weakness. In this environment, even Bitcoin, as the dominant cryptocurrency, has been unable to isolate itself from selling pressure, reinforcing the likelihood of extended downside moves in the short term.
Bitcoin loses value rapidly
Source: StoneX, Tradingview
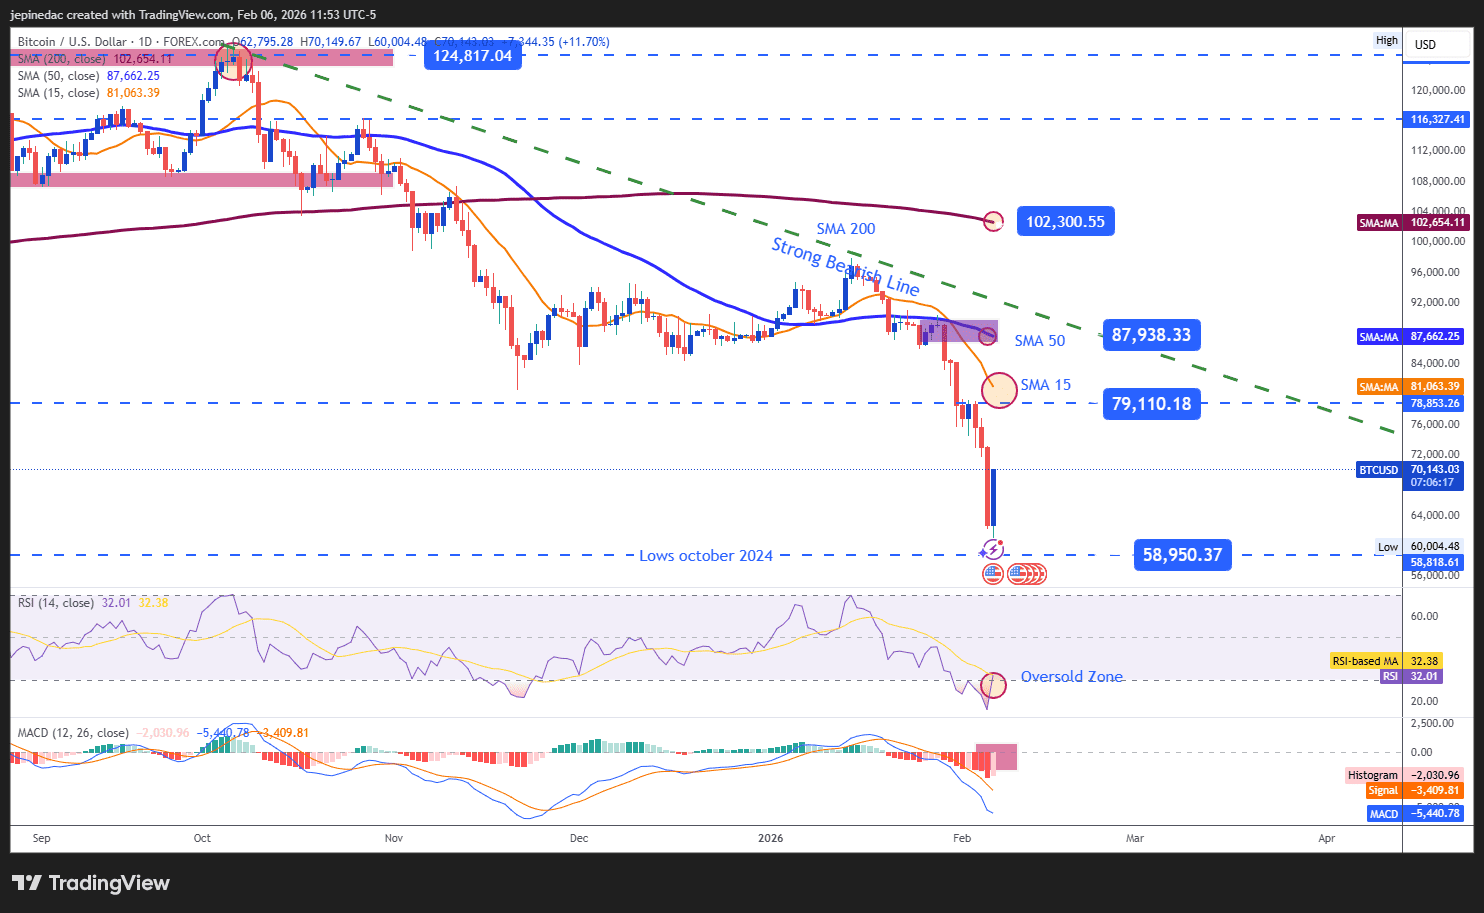
Although Bitcoin attempted to recover the $70,000 area toward the end of the week, the short-term dominant bias remains bearish, and recent losses are still far from being fully absorbed. The bearish trendline, in place since the all-time highs, continues to be the most relevant technical structure, with no clear signs of a breakout in the near term. That said, the magnitude of the recent sell-off has created conditions that could allow for short-term technical rebounds, though these do not necessarily imply a trend reversal.
Indicators:
- Both the RSI and the MACD remain below their neutral levels (50 for RSI and 0 for MACD), confirming that the bearish bias continues to dominate average market behavior. However, the RSI has entered oversold territory, with readings below 30, suggesting a recent excess of selling pressure and opening the door to short-term technical corrections to the upside.
Key levels:
- $87,900 – Key resistance: An area aligned with the 50-period simple moving average and the bearish trendline. A sustained move toward this level could put the bearish structure at risk and enable a more meaningful bullish bias.
- $79,000 – Nearby barrier: A neutral zone, aligned with the 15-period moving average, which could serve as a reference for short-term technical rebounds.
- $58,900 – Key support: A level not seen since October 2024, now representing the most important downside barrier. A sustained break below this zone could trigger a more aggressive extension of the downtrend in the weeks ahead.
Ripple attempts to withstand selling pressure
Source: StoneX, Tradingview
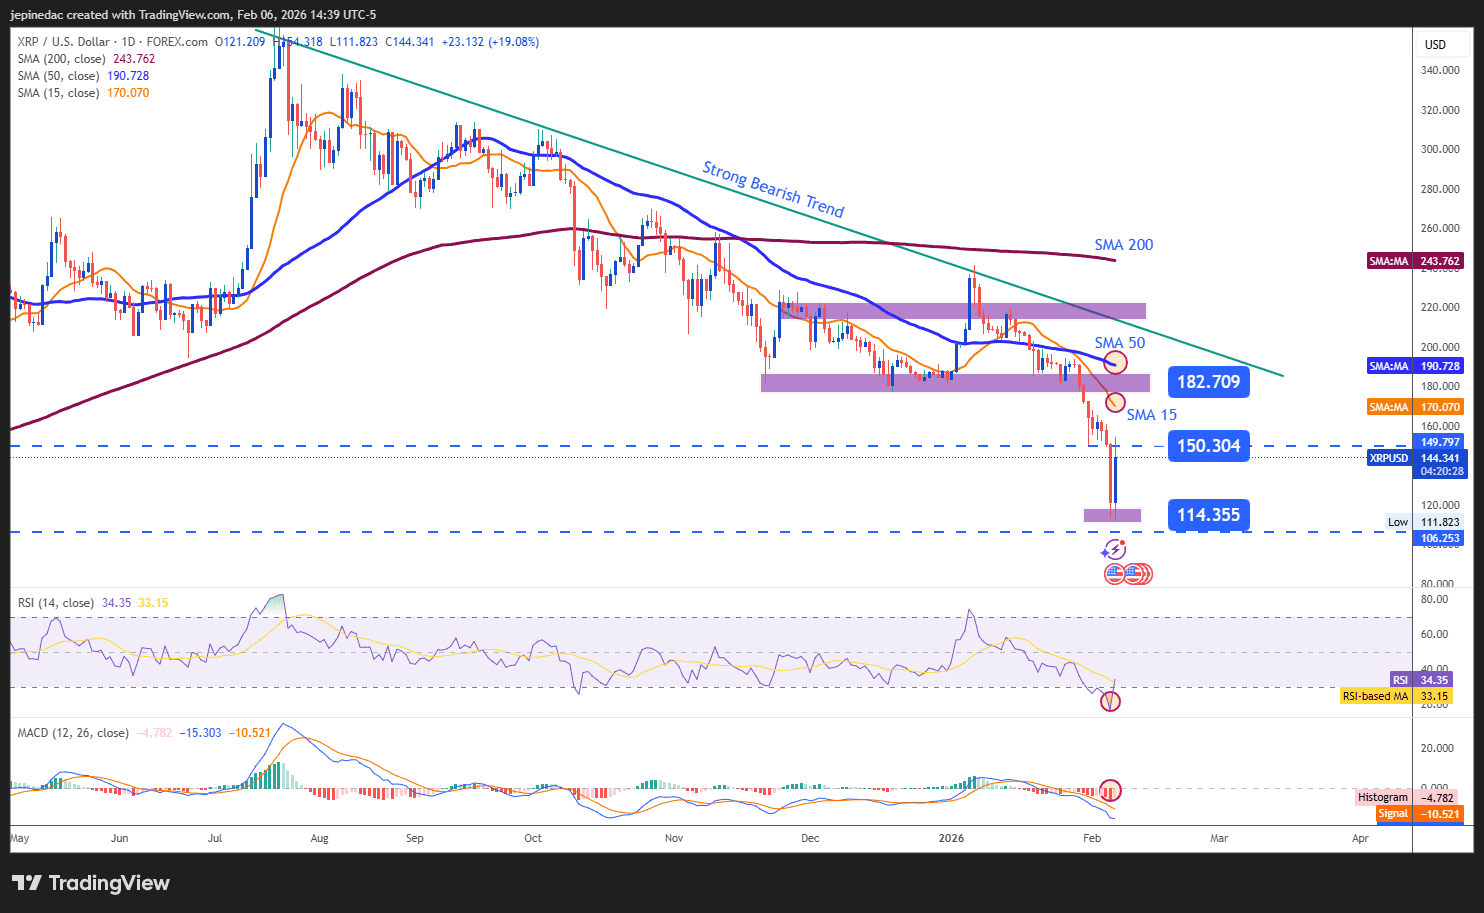
Ripple stands out as the cryptocurrency that has contained losses more effectively compared to the broader market. Although the chart remains dominated by a bearish trend, the weekly close shows a notable recovery, reversing a large portion of the sharp sell-off recorded on February 5.
Indicators:
- Both the RSI and the MACD remain below their neutral levels, indicating that the bearish bias is still dominant. However, the RSI has begun to rebound from oversold territory, signaling the emergence of short-term buying momentum, which could extend the current corrective moves.
Key levels:
- 182.709 – Key resistance: A level located between the 50- and 15-period moving averages, acting as the main upside barrier. A sustained return toward this area could put the current bearish structure at risk.
- 150.304 – Nearby barrier: A recent neutral zone, which may serve as a reference for short-term technical rebounds.
- 114.355 – Key support: A level aligned with recent lows, representing the most important downside barrier. A break below this zone could enable the development of a more aggressive bearish trend.
Written by Julian Pineda, CFA, CMT – Market Analyst
Follow him on: @julianpineda25