



ADP Employment Change stronger than expected; lifts USD/JPY
Good news from the jobs front has sent the US Dollar higher in anticipation of a more hawkish Fed. USD/JPY has followed right along with it.
Share this:

The US ADP Employment Change for December showed that 235,000 private jobs were added to the economy vs an expectation of +150,000. November’s print was revised higher from +127,000 to +182,000. Keep in mind however that ADP has recently changed its methodology for calculating its Employment Change. In addition, ADP has also said that this is not to be used as a leading indicator for Non-Farm Payrolls, which are to be released on Friday. Expectations for the NFP print are +200,000 vs +263,000 in November. Traders don’t seem to care about what the ADP says. Stocks sold off on the print and the US Dollar went bid as traders worry that stronger jobs may allow the Fed to be more aggressive in its rate hikes. It should also be noted that Initial Jobless Claims for the week ending December 31st, was only 204,000 vs and expectation of 225,000 and a previous reading of 223,000. This indicates that less people applied for unemployment benefits during the last week of the year than was anticipated. It was also the lowest reading since late September 2022.
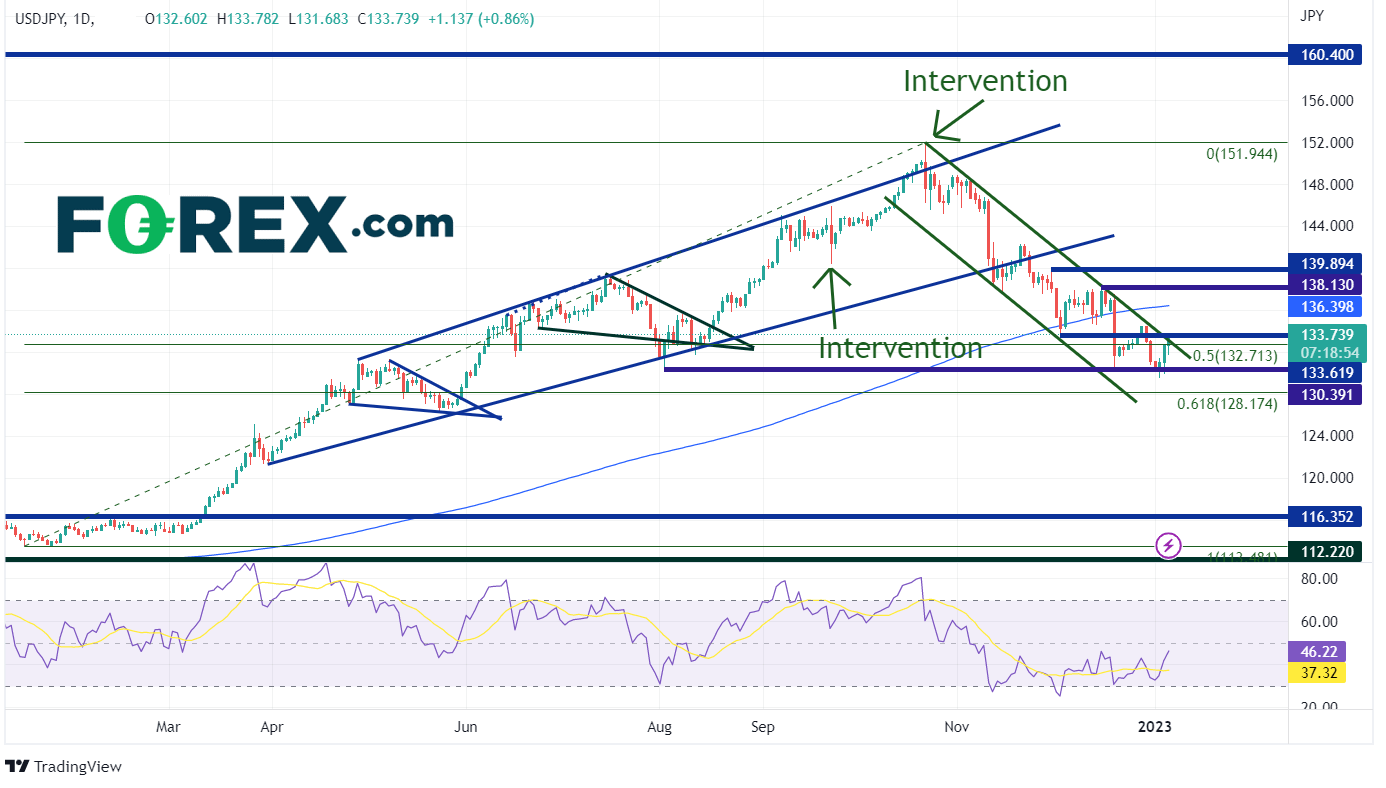
USD/JPY rose aggressively during the first three quarters of 2022, trading from a low on January 14th, 2022, at 113.48 to a high on October 21st at 151.95. Since then, the pair has pulled back aggressively in an orderly downward sloping channel, closing the year below the 50% retracement from last year’s low to high at 130.77. However, USD/JPY has moved higher this week after holding horizontal support from the lows of August 2nd, 2022, at 130.39. The pair has traded higher for the past 3 days (including Thursday) and is threatening to break out above the top of the channel trendline near 133.62.
Source: Tradingview, Stone X
On a 240-minute chart, USD/JPY is nearing pervious support and the highs from December 28th at 134.50. This acts as the first level of resistance. Above there, the pair can move to the 200 Day Moving Average at 136.40 (see daily), then the highs of December 15th at 138.13. However, if this move above the long-term channel proves to be a false breakout, USD/JPY may pullback. First support is at the top trendline of the channel near 132.70. Below there, price can fall to the lows from January 2nd at 129.67 and then the 61.8% Fibonacci retracement level from the 2022 lows to the 2022 highs at 128.17.

Source: Tradingview, Stone X
Good news from the jobs front has sent the US Dollar higher in anticipation of a more hawkish Fed. USD/JPY has followed right along with it. Will the pair continue to move higher? It may depend on the Non-Farm Payroll data due out on Friday!
The US ADP Employment Change for December showed that 235,000 private jobs were added to the economy vs an expectation of +150,000. November’s print was revised higher from +127,000 to +182,000. Keep in mind however that ADP has recently changed its methodology for calculating its Employment Change. In addition, ADP has also said that this is not to be used as a leading indicator for Non-Farm Payrolls, which are to be released on Friday. Expectations for the NFP print are +200,000 vs +263,000 in November. Traders don’t seem to care about what the ADP says. Stocks sold off on the print and the US Dollar went bid as traders worry that stronger jobs may allow the Fed to be more aggressive in its rate hikes. It should also be noted that Initial Jobless Claims for the week ending December 31st, was only 204,000 vs and expectation of 225,000 and a previous reading of 223,000. This indicates that less people applied for unemployment benefits during the last week of the year than was anticipated. It was also the lowest reading since late September 2022.
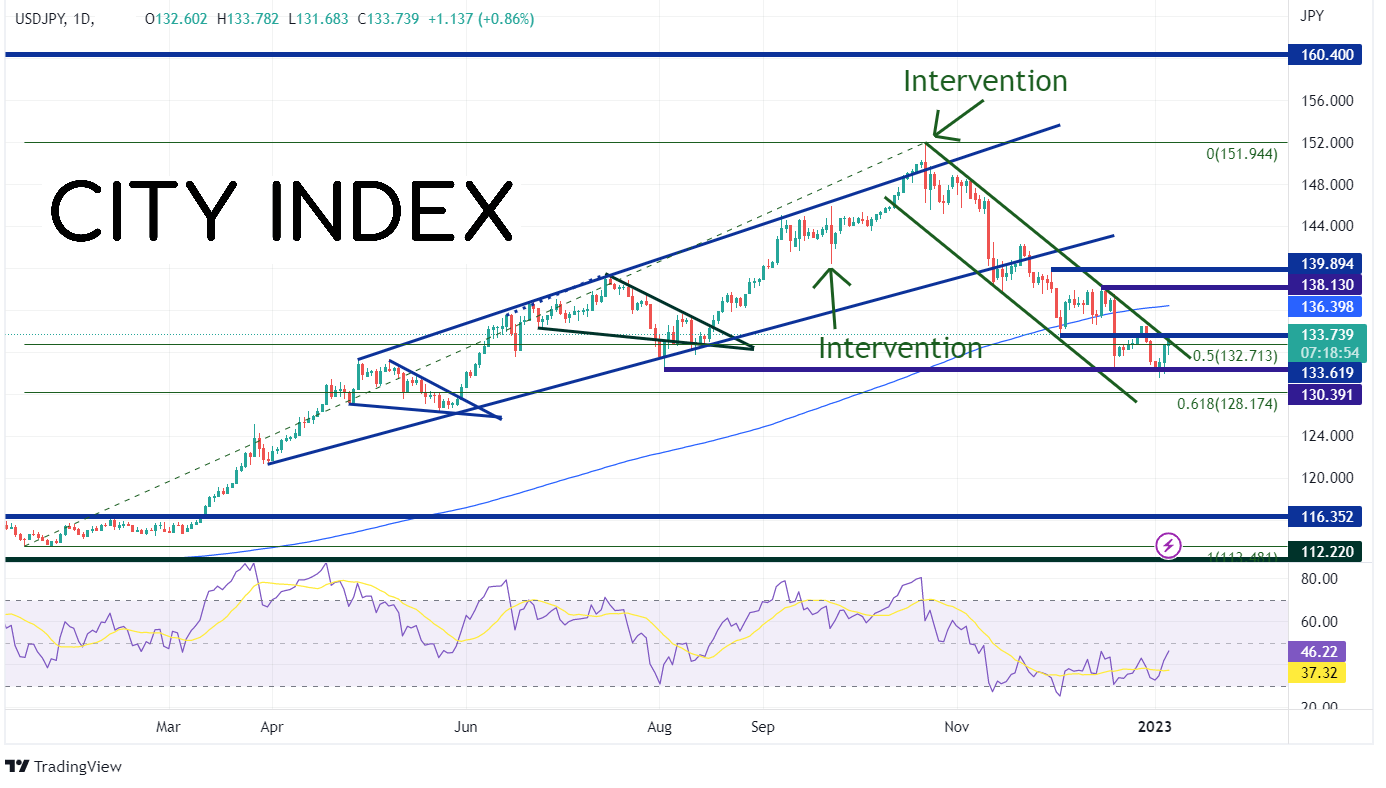
USD/JPY rose aggressively during the first three quarters of 2022, trading from a low on January 14th, 2022, at 113.48 to a high on October 21st at 151.95. Since then, the pair has pulled back aggressively in an orderly downward sloping channel, closing the year below the 50% retracement from last year’s low to high at 130.77. However, USD/JPY has moved higher this week after holding horizontal support from the lows of August 2nd, 2022, at 130.39. The pair has traded higher for the past 3 days (including Thursday) and is threatening to break out above the top of the channel trendline near 133.62.
Source: Tradingview, Stone X
Trade USD/JPY now: Login or Open a new account!
• Open an account in the UK
• Open an account in Australia
• Open an account in Singapore
On a 240-minute chart, USD/JPY is nearing pervious support and the highs from December 28th at 134.50. This acts as the first level of resistance. Above there, the pair can move to the 200 Day Moving Average at 136.40 (see daily), then the highs of December 15th at 138.13. However, if this move above the long-term channel proves to be a false breakout, USD/JPY may pullback. First support is at the top trendline of the channel near 132.70. Below there, price can fall to the lows from January 2nd at 129.67 and then the 61.8% Fibonacci retracement level from the 2022 lows to the 2022 highs at 128.17.

Source: Tradingview, Stone X
Good news from the jobs front has sent the US Dollar higher in anticipation of a more hawkish Fed. USD/JPY has followed right along with it. Will the pair continue to move higher? It may depend on the Non-Farm Payroll data due out on Friday!
Learn more about forex trading opportunities.
Related tags:

Open an account in minutes
Experience award-winning platforms with fast and secure execution, and enjoy tight spreads from 0.5 pts on FX and 0.3 pts on indices.
Economic calendar
Web Trader platform
Our sophisticated web-based platform is packed with features.
Related articles

Dow Jones forecast: Stock markets under pressure from multiple sources
When looking at the major tech-heavy US indices like the S&P 500 or the Nasdaq 100, you wouldn’t think that the stock market is particularly weak. Yet, beneath the surface, the market is far from healthy right now. Investors are evidently just piling into the big tech and AI names, and as a result, market breadth is deteriorating. Other indices like the small cap Russell 2000 and the Dow Jones are starting to reflect that weakness.


Tankan Backs BOJ Tightening, but Yen Rate Expectations Ease
Japan’s Tankan supports further BOJ tightening, although softer rate expectations could limit support for the Japanese yen.


Nikkei breakout accelerates as yen weakness returns
Nikkei has started October with a powerful breakout, helped by renewed yen weakness and strong upside momentum

This report is intended for general circulation only. It should not be construed as a recommendation, or an offer (or solicitation of an offer) to buy or sell any financial products. The information provided does not take into account your specific investment objectives, financial situation or particular needs. Before you act on any recommendation that may be contained in this report, independent advice ought to be sought from a financial adviser regarding the suitability of the investment product, taking into account your specific investment objectives, financial situation or particular needs.
StoneX Financial Pte. Ltd., may distribute reports produced by its respective foreign entities or affiliates within the StoneX group of companies or third parties pursuant to an arrangement under Regulation 32C of the Financial Advisers Regulations. Where the report is distributed to a person in Singapore who is not an accredited investor, expert investor or an institutional investor (as defined in the Securities Futures Act), StoneX Financial Pte. Ltd. accepts legal responsibility to such persons for the contents of the report only to the extent required by law. Singapore recipients should contact StoneX Financial Pte. Ltd. at 6826 9988 for matters arising from, or in connection with the report.
In the case of all other recipients of this report, to the extent permitted by applicable laws and regulations neither StoneX Financial Pte. Ltd. nor its associated companies will be responsible or liable for any loss or damage incurred arising out of, or in connection with, any use of the information contained in this report and all such liability is hereby expressly disclaimed. No representation or warranty is made, express or implied, that the content of this report is complete or accurate.
StoneX Financial Pte. Ltd. is not under any obligation to update this report.
Trading CFDs carries a high level of risk that may not be suitable for some investors. Consider your investment objectives, level of experience, financial resources, risk appetite and other relevant circumstances carefully. The possibility exists that you could lose some or all of your investments, including your initial deposits. If in doubt, please seek independent expert advice. Visit www.forex.com/en-sg/terms-and-policies for the complete Risk Disclosure Statement.