



Asian Open: Santa’s rally stumps its mistletoe, Nikkei bulls return
It looked like Santa’s rally was underway post-FOMC with S&P 500 futures hitting an all-time high. Until US indices handed back all gains to close lower for the day.
Share this:

Asian Futures:
- Australia's ASX 200 futures are up 0 points (0.51%), the cash market is currently estimated to open at 7,295.70
- Japan's Nikkei 225 futures are down -260 points (-0.9%), the cash market is currently estimated to open at 28,806.32
- Hong Kong's Hang Seng futures are down 1 points (0%), the cash market is currently estimated to open at 23,476.50
- China's A50 Index futures are down -35 points (-0.22%), the cash market is currently estimated to open at 16,123.47
Thursday US Close:
- The Dow Jones Industrial fell -29.79 points (-0.08%) to close at 35,897.64
- The S&P 500 index fell -41.18 points (-0.88%) to close at 4,668.67
- The Nasdaq 100 index fell -425.657 points (-2.61%) to close at 15,863.94
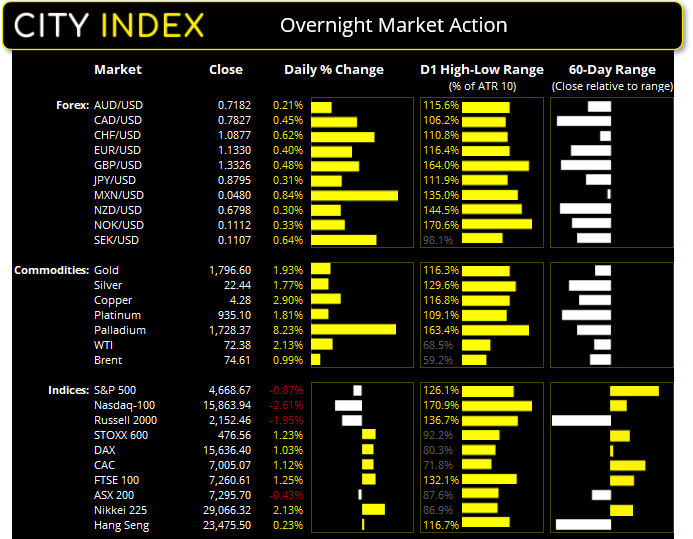

It has been a busy 24-hours for central banks with the FOMC, BOE and ECB all taking turns in the spotlight. Whilst equities initially rallied following Jerome Powell’s press conference, growth stocks were offloaded by investors which weighed on the broader market. But we also saw the BOE come out swinging with an unexpected hike, whilst the ECB trimmed reduced one form of stimulus and ramped up another. It’s therefore likely some investors simply want to book profits and absorb the contrasting flow of information despite the lure of Santa’s rally. The Nasdaq 100 fell -2.6% and formed a bearish engulfing candle on the daily chart. The S&P 500 was down -0.9% although the Dow was effectively flat at -0.08%.
Bullish interest returns to the Nikkei 225
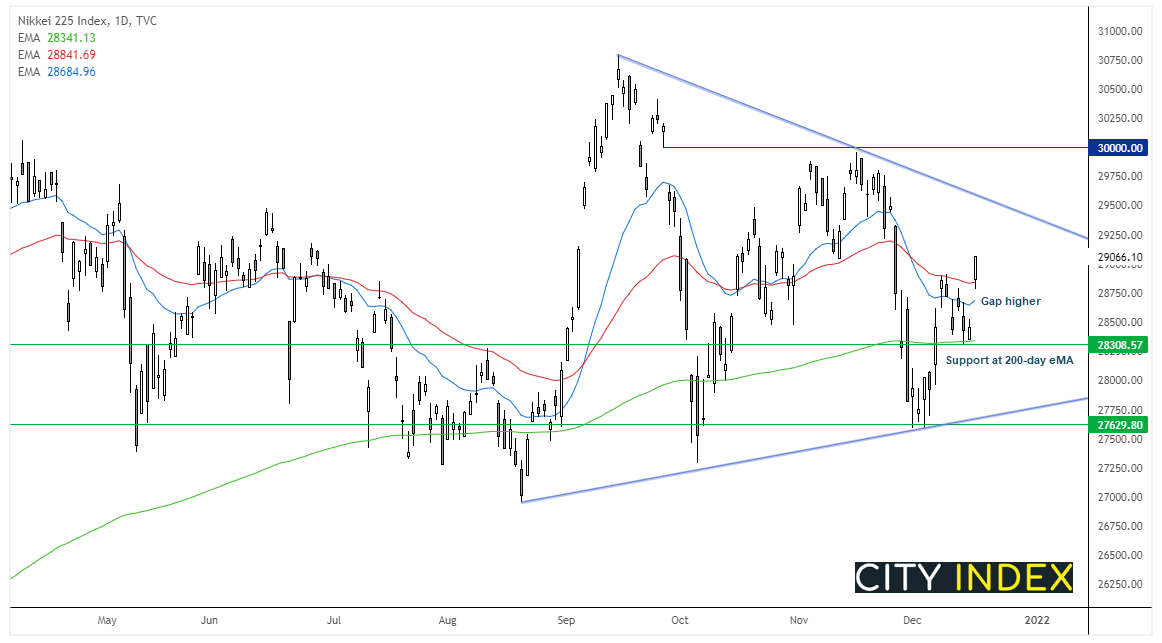

If we take a step back, we can see that the Nikkei 225 is trading in a large triangle formation on the daily chart. The main issue with hit however is that there is no clear trend preceding it, so it best we simply have a sloping trend support and resistance level. Yet higher lows clearly formed around 27.6k and its break above the 200-day eMA found support at it upon a retracement. Prices gaped higher yesterday and found support at the 50-day eMA, so we are now targeting a rally to said trend resistance. Should prices break yesterday’s high and make no attempt to fill the gap we will have greater confidence in the initial target being met sooner than later.
Read our guide on the Nikkei 225 trading guide
Read our guide on the Nikkei 225 trading guide
BOE: The contrarian boyfriend?
The BOE hiked interest rates by 25 bps yesterday, making it the second BOE meeting in a row where the central bank has done the complete opposite of market expectations. A November hike that was fully priced in never materialised, then December’s originally anticipated hike was repriced at 0% probability, only to see BOE hike. Their forward guidance could do with some work, perhaps?
GBP/JPY reached our bullish triangle target around 152.50 before revering the day’s gains post-ECB. It has invalidated its bearish trendline but the volatility of yesterday means we’ll step aside. GBP/USD was a top performer closed above 133.00.
US dollar index on track for another indecision week
Of course, there is another day of trading until the weekend but at the time of writing DXY (dollar index) is trading around 96.0, a level it has closed around the prior 4-weeks with three failed upper spikes stalling below 97.0. Perhaps the US dollar rally is now a little ‘long’ in the tooth and requires a pullback?
Gold glistened its way to a 1.2% rally
Yesterday’s rally was its best in 6-weeks and stopped just shy of 1800. We suspect traders took note of Powell’s comments on inflation being entrenched to help propel gold higher. Although there are several levels of resistance around 1800 which may scupper the rally being extended for now, unless we do see a deeper pullback on the US dollar.
WTI remains rangebound and in need of a catalyst. It may have invalidated trend resistance on the daily chart yet we need to see a break (or daily close) above 73.34 before becoming confident the break of trendline means anything. Otherwise a break / daily close below $70 places bears firmly back in control.
ASX 200 Market Internals:
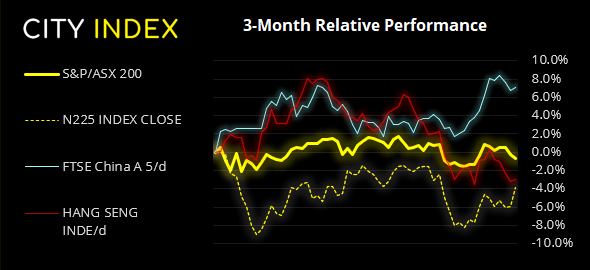

ASX 200: 7295.7 (-0.43%), 16 December 2021
- Information Technology (2.07%) was the strongest sector and Healthcare (-5.07%) was the weakest
- 6 out of the 11 sectors closed lower
- 9 out of the 11 sectors outperformed the index
- 106 (53.00%) stocks advanced, 84 (42.00%) stocks declined
- 57% of stocks closed above their 200-day average
- 51.5% of stocks closed above their 50-day average
- 46% of stocks closed above their 20-day average
Outperformers:
- + 10.9% - Mesoblast Ltd (MSB.AX)
- + 6.89% - WiseTech Global Ltd (WTC.AX)
- + 5.4% - Lifestyle Communities Ltd (LIC.AX)
Underperformers:
- -8.16% - CSL Ltd (CSL.AX)
- -6.00% - Champion Iron Ltd (CIA.AX)
- -5.48% - Life360 Inc (360.AX)
Up Next (Times in AEDT)
How to trade with City Index
You can easily trade with City Index by using these four easy steps:
- Open an account, or log in if you’re already a customer
• Open an account in the UK
• Open an account in Australia
• Open an account in Singapore
- Search for the company you want to trade in our award-winning platform
- Choose your position and size, and your stop and limit levels
- Place the trade
How to trade with FOREX.com
Follow these easy steps to start trading with FOREX.com today:
- Open a Forex.com account, or log in if you’re already a customer.
- Search for the pair you want to trade in our award-winning platform.
- Choose your position and size, and your stop and limit levels.
- Place the trade.
Related tags:


Open an account in minutes
Experience award-winning platforms with fast and secure execution, and enjoy tight spreads from 0.5 pts on FX and 0.3 pts on indices.
Economic calendar
Web Trader platform
Our sophisticated web-based platform is packed with features.
Related articles
AUD/USD hammered by US yields and fading RBA hike bets
US yields, dollar strength and fading RBA hike bets have combined to drive AUD/USD to fresh multi-month lows. The macro and technical bias remains bearish, although history suggests parts of the move are now reaching unusually stretched levels.

Japanese Yen Outlook: USD/JPY, GBP/JPY, AUD/JPY Setups
USD/JPY and GBP/JPY show signs of stabilising, while AUD/JPY remains vulnerable as yen crosses deliver mixed technical signals.

S&P 500 Forecast: SPX Continues to Drift Away from Record Highs
Recent trading sessions have done little to restore confidence in the equity market. Over the last four sessions, the S&P 500 has declined by nearly 1.00%, a move that highlights growing short-term weakness and keeps the index moving further away from its record-high territory.

This report is intended for general circulation only. It should not be construed as a recommendation, or an offer (or solicitation of an offer) to buy or sell any financial products. The information provided does not take into account your specific investment objectives, financial situation or particular needs. Before you act on any recommendation that may be contained in this report, independent advice ought to be sought from a financial adviser regarding the suitability of the investment product, taking into account your specific investment objectives, financial situation or particular needs.
StoneX Financial Pte. Ltd., may distribute reports produced by its respective foreign entities or affiliates within the StoneX group of companies or third parties pursuant to an arrangement under Regulation 32C of the Financial Advisers Regulations. Where the report is distributed to a person in Singapore who is not an accredited investor, expert investor or an institutional investor (as defined in the Securities Futures Act), StoneX Financial Pte. Ltd. accepts legal responsibility to such persons for the contents of the report only to the extent required by law. Singapore recipients should contact StoneX Financial Pte. Ltd. at 6826 9988 for matters arising from, or in connection with the report.
In the case of all other recipients of this report, to the extent permitted by applicable laws and regulations neither StoneX Financial Pte. Ltd. nor its associated companies will be responsible or liable for any loss or damage incurred arising out of, or in connection with, any use of the information contained in this report and all such liability is hereby expressly disclaimed. No representation or warranty is made, express or implied, that the content of this report is complete or accurate.
StoneX Financial Pte. Ltd. is not under any obligation to update this report.
Trading CFDs carries a high level of risk that may not be suitable for some investors. Consider your investment objectives, level of experience, financial resources, risk appetite and other relevant circumstances carefully. The possibility exists that you could lose some or all of your investments, including your initial deposits. If in doubt, please seek independent expert advice. Visit www.forex.com/en-sg/terms-and-policies for the complete Risk Disclosure Statement.