







AUD/USD, ASX get caught up in Wall Street’s volatility, AU GDP up next
US traders were quick to short Wall Street indices after the long weekend, at the beginning of a month generally associated with bearish stocks. AUD/USD and ASX 200 futures were also caught in the commotion during a risk-off session.
Share this:
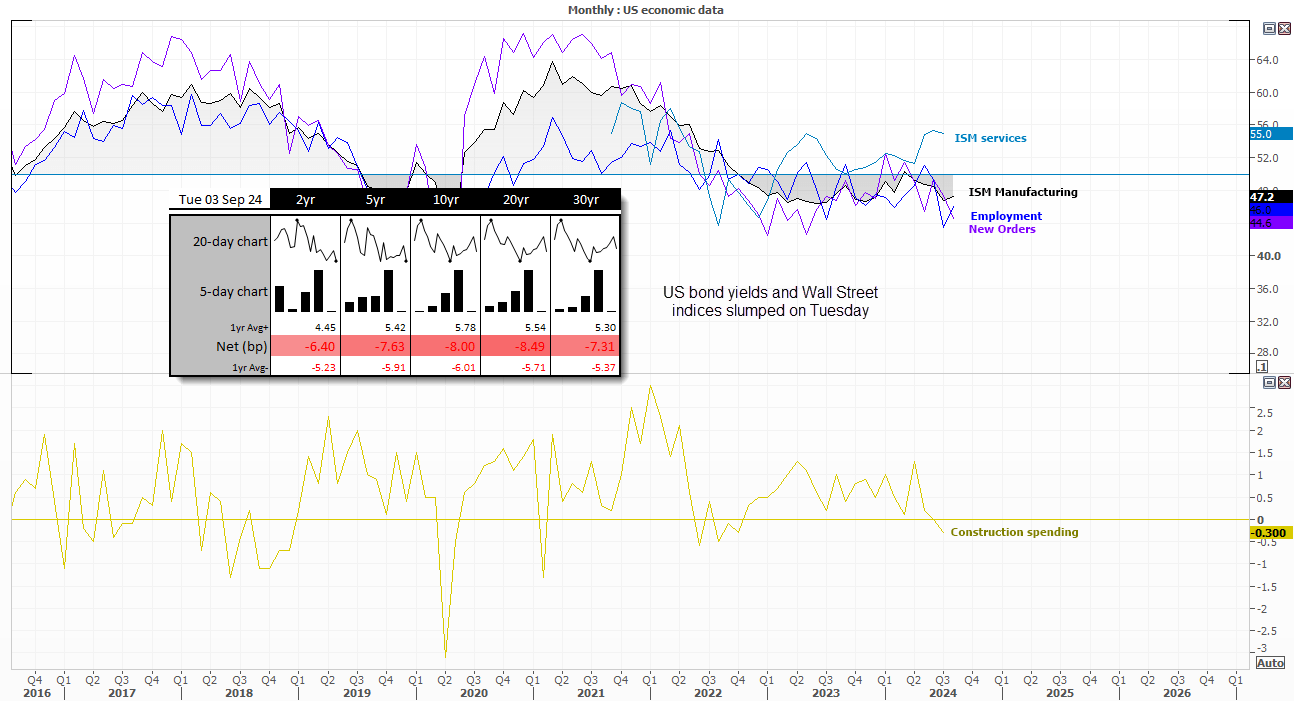
Wall Street indices were quick to turn south after the long weekend, with traders being extra sensitive to weak data at the beginning of a month which is well known to disappoint for stocks. ISM manufacturing, construction spending, economic optimism and GDPnow numbers were all below expectations which fanned fears of an economic slowdown ahead of a week full of key economic data.
ISM manufacturing contracted for a fifth month but at a slightly slower pace, new orders fell at their fastest pace in 15 months. Employment was also lower but at a slower pace. Survey respondents continued to litter the survey with recessionary comments as they did the month prior, although there was some optimism.
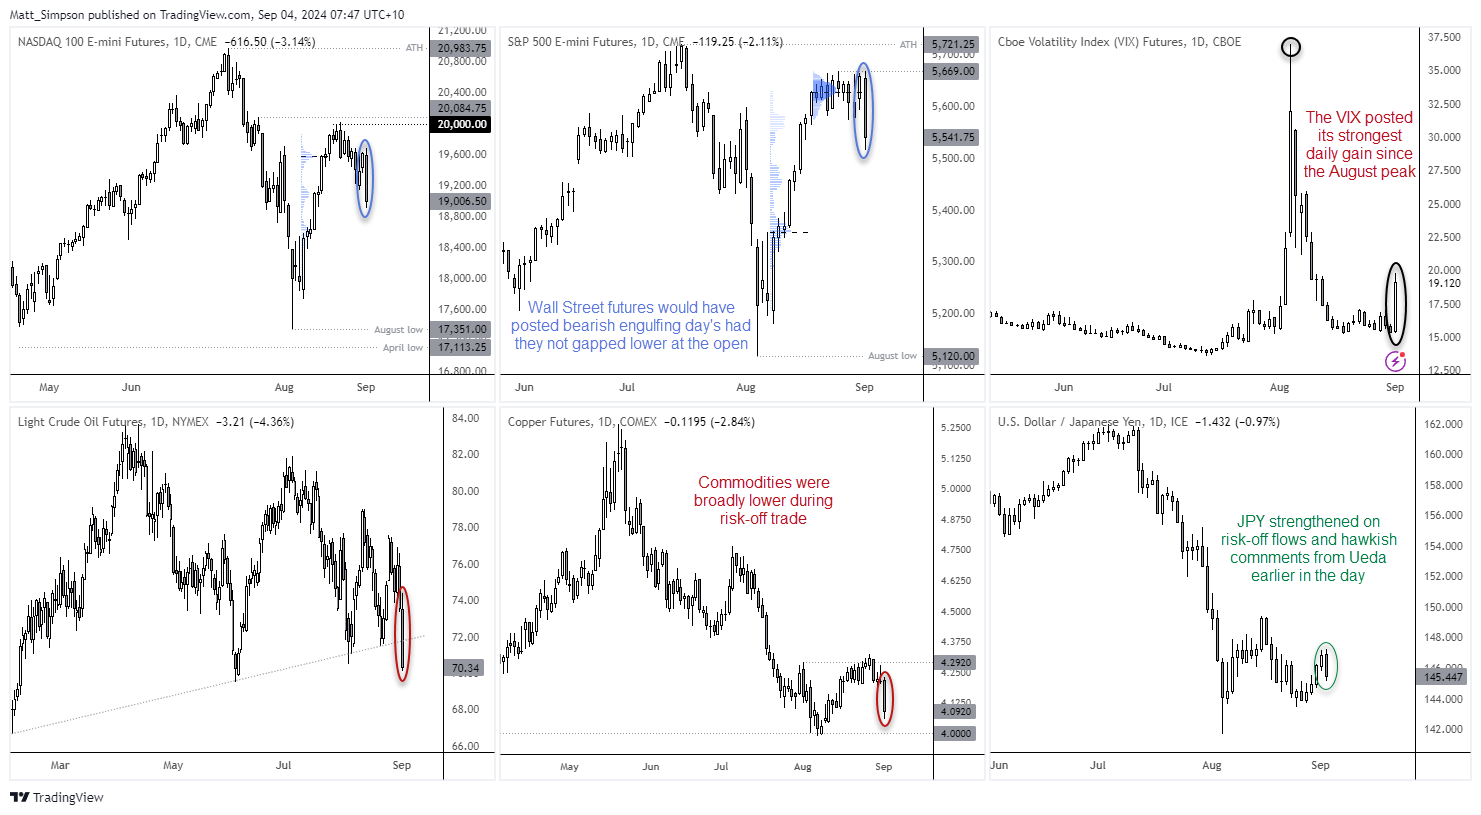
- Wall Street indices would have formed bearish outside days, had they not gapped lower at the open
- The Nasdaq 100 fell -3.2% during its worst day in six weeks
- The S&P 500 was down -2.1% during its worst day in a month
- WTI crude oil fell -4.3% during its worst day since early January
- Gold futures fell to a 7-day low but held above $2500 before recouping around half of the day’s losses
- Silver fell over -2.8% for a second day before finding support at $28
- The VIX rose 5.8 points, its biggest 1-day advance since the August top of 192
- A bearish engulfing day formed on USD/JPY and it closed below 146
- Commodity currencies AUD, CAD and NZD were all lower against the US dollar during risk-off trade
The Japanese yen was the strongest major thanks to risk-off flows. Although hawkish comments from BOJ governor Ueda had already lifted the yen, as talks of hikes were reiterated. Although the fact the BOJ previously walked back their hawkishness due to the rise in volatility, the same could happen again if they deem the yen strengthens too fast for their liking.
There’s a real risk that Australia could print a negative GDP figure today, with exports and current account figures falling well short of expectations on Tuesday. The current account fell -10.7 billion in Q2, marking the second consecutive quarterly deficit and fastest decline since Q4 2018. The net export contribution to GDP rose just 0.2% q/q, below 0.6% expected. The weak balance of payments figures some Australian banks to downgrade their GDP forecast to as little as 0.1%, but with a host of other indicators pointing to sluggish growth then investors may want to be on guard for a negative print.
Events in focus (AEDT):
Australia’s GDP figures will be the main event in the APAC session, where many RBA watchers, consumers and businesses will be crossing their fingers for a weak print. And they may just get one looking at yesterday’s BOP figures. A negative print could bolster bets of a December cut and increase odds of another in April.
The Bank of Canada (BOC) are expected to cut their cash rate by -25bp. Decisions remain on a ‘per meeting basis’, although economists and money markets are pricing in further cuts this year. The question therefore is where the BOC will indicate it at this meeting for a dovish cut, and market their third successive cut in as many meeting.
The JOLTS job openings figure will also warrant attention for Fed watchers, given the anticipation of Friday’s nonfarm payroll report. Again, doves and USD bears will be crossing their fingers for a notable fall to mark a weakening jobs market to bolster bets of multiple Fed cuts.
- 09:00 – AU PMIs (AIG)
- 10:30 – JP services PMI
- 10:30 – HK manufacturing PMI
- 11:00 – ANZ commodity price index
- 11:30 – AU GDP (ABS), inflation gauge (MI)
- 17:55 – DE PMIs (final)
- 18:00 – EU PMIs (final)
- 18:30 – UK PMIs (final)
- 23:45 – BOC cash rate decision
- 00:00 – US job openings (JOLTS), durable goods, factory orders
- 00:30 – BOC press conference
AUD/USD technical analysis:
We have seen the pullback on AUD/USD I had been anticipating, although its drop was sooner and more sudden than expected. And this just goes to show how sensitive traders are to weak US economic data. It may however even stolen the thunder from today’s GDP report, even if it does print a negative figure.
The daily RSI is not yet oversold, so perhaps there is more downside potential for AUD/USD. Yet it is oversold on the 1-hour chart with prices holding above the 67c handle and 0.6697 low. Perhaps there’s room for a small bounce if GDP does not miss expectations. Beyond that, AUD/USD remains a pair I favour to sell into rallies with a move down to 0.6650 potentially on the cards, near the monthly pivot point. Also note the 200-day MA sits just above the 66c handle, making it another support zone for bears to potentially target.
ASX 200 futures (SPI 200) technical analysis:
Where Wall Street goes, the ASX 200 tends to follow at the moment. ASX 200 futures formed a large bearish engulfing day and closed below 8,000. The daily RSI (2) is nearly within the oversold zone, an prices are holding above the 7940 low with the 4-hour RSI having curled up from its oversold zone. Like AUD/USD, perhaps there’s room for a small bounce. But given the large engulfing day at the tops of a strong rally, my preference remains to fade into rallies back towards recent highs,. Assuming any rebound gets that far, in a month associated with losses.
View the full economic calendar
View the full economic calendar
-- Written by Matt Simpson
Follow Matt on Twitter @cLeverEdge
How to trade with City Index
You can trade with City Index by following these four easy steps:
- Open an account, or log in if you’re already a customer
• Open an account in the UK
• Open an account in Australia
• Open an account in Singapore
- Search for the market you want to trade in our award-winning platform
- Choose your position and size, and your stop and limit levels
- Place the trade
Related tags:


Open an account in minutes
Experience award-winning platforms with fast and secure execution, and enjoy tight spreads from 0.5 pts on FX and 0.3 pts on indices.
Economic calendar
Web Trader platform
Our sophisticated web-based platform is packed with features.
Related articles
Gold Q4 2026 outlook: Resilience in the face of rallying dollar and yields
As we headed towards the latter stages of Q3 and into Q4, the Fed had just hiked rates in a hawkish FOMC meeting, while the likes of the ECB and BoJ had also tightened their respective policies. Oil prices remained elevated amid the prolonged US-Iran conflict. Meanwhile, bond yields were breaking out, and the dollar was higher across the board. Yet, remarkably, gold was still holding in the positive territory for the third quarter, even if it had weakened somewhat in September.


EUR/USD Q4 2026 Outlook: Euro at a Crossroads as Fed, ECB Tighten 9 25 2026
EUR/USD enters Q4 at a pivotal inflection point as competing Fed-ECB policy paths and persistent inflation risks collide with major technical support.


AUD/USD Q4 Outlook: RBA and Fed Hikes Set the Tone
AUD/USD enters Q4 with RBA and Fed hikes in focus as sticky inflation, rising unemployment and US dollar strength shape the Australian dollar.
This report is intended for general circulation only. It should not be construed as a recommendation, or an offer (or solicitation of an offer) to buy or sell any financial products. The information provided does not take into account your specific investment objectives, financial situation or particular needs. Before you act on any recommendation that may be contained in this report, independent advice ought to be sought from a financial adviser regarding the suitability of the investment product, taking into account your specific investment objectives, financial situation or particular needs.
StoneX Financial Pte. Ltd., may distribute reports produced by its respective foreign entities or affiliates within the StoneX group of companies or third parties pursuant to an arrangement under Regulation 32C of the Financial Advisers Regulations. Where the report is distributed to a person in Singapore who is not an accredited investor, expert investor or an institutional investor (as defined in the Securities Futures Act), StoneX Financial Pte. Ltd. accepts legal responsibility to such persons for the contents of the report only to the extent required by law. Singapore recipients should contact StoneX Financial Pte. Ltd. at 6826 9988 for matters arising from, or in connection with the report.
In the case of all other recipients of this report, to the extent permitted by applicable laws and regulations neither StoneX Financial Pte. Ltd. nor its associated companies will be responsible or liable for any loss or damage incurred arising out of, or in connection with, any use of the information contained in this report and all such liability is hereby expressly disclaimed. No representation or warranty is made, express or implied, that the content of this report is complete or accurate.
StoneX Financial Pte. Ltd. is not under any obligation to update this report.
Trading CFDs carries a high level of risk that may not be suitable for some investors. Consider your investment objectives, level of experience, financial resources, risk appetite and other relevant circumstances carefully. The possibility exists that you could lose some or all of your investments, including your initial deposits. If in doubt, please seek independent expert advice. Visit www.forex.com/en-sg/terms-and-policies for the complete Risk Disclosure Statement.