







AUD/USD weekly outlook: June 10th 2024
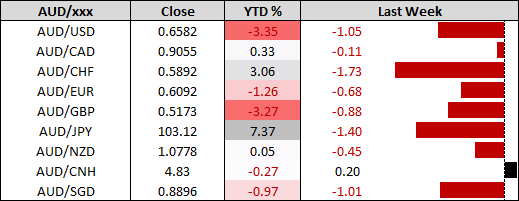
AUD/USD suffered its worst day in five weeks on Friday after a strong NFP report saw the USD wipe out a week's worth of losses in just two hours.
Share this:

What a difference one report can make. Friday’s strong NFP report saw the US dollar surge and unwind all of the prior week’s losses within a couple of hours. And that leaves hopes of a September Fed cut in tatters. The 272k jobs added blew away the 182k expected and earnings was also higher, which saw traders look past unemployment rising to a 2-year high of 4%. The USD index rose 1.4% from the day’s low to high on Friday and AUD/USD suffered its worst day’s performance in five weeks.
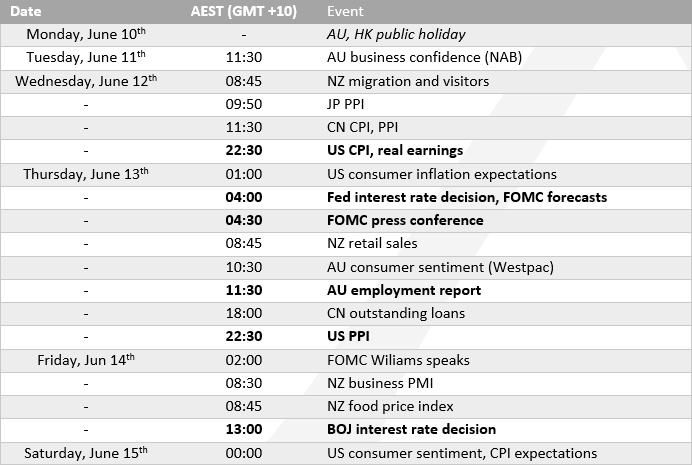
It will be a slow start to the week with public holidays in Australia and Hong Kong and local stock exchanges closed. Apart from NAB's business confidence report on Tuesday and CPI data from China on Wednesday, we need to wait until Wednesday night before things likely kick off.
The US releases a key inflation report just hours ahead of an FOMC meeting, which leaves plenty of opportunity for volatile swings during the sleeping hours of those in APAC. But with employment figures coming in so hot, it could take a particularly soft set of inflation figures to revive hopes of a September cut. Whereas a hot set of inflation figures could send yields and the US dollar higher still.
Australia’s labour force report on Thursday is the main domestic event, although it seems unlikely to be a major event. We know the economy is slowly softening, yet employment figures remain fairly decent. So, we’d need to see a particularly poor set of data to rekindle hopes of an RBA cut. 30k jobs are expected to have been added in May, down from 38.5k in April. Unemployment is expected to cool to 4% from 4.1%.
It is worth noting that since 2007, the headline jobs figure has beaten forecasts 62.2% of the time, come in below 36.8%, and on target 0.96%. This suggests a very low probability of it coming in at 30k, with roughly a 2/3 chance of it being above 30k. If coupled with 4% unemployment or lower, then it is hard to justify an RBA cut any time soon. As of Friday’s close, RBA cash rate futures imply just a 5% chance of a 25bp cut at their next meeting.
AUD/USD 20-day rolling correlation
- The 20-day correlation between the USD index and AUD/USD has lowered to 0.8%, although Friday’s price action shows the relationship remains strong
- Correlations with gold, copper, and oil curled higher over the past week, with gold being the strongest correlation at 0.68 and WTI seemingly uncorrelated at 0.1
- AUD/USD’s relationship with iron ore remains non existent, with a reading of -0.02
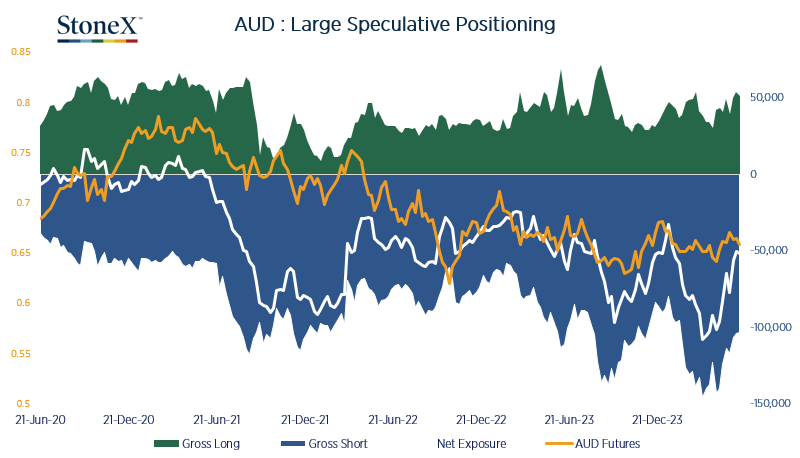
AUD/USD futures – market positioning from the COT report:
- Large speculators increased their net-long exposure to AUD/USD futures by 1.4k contracts
- However, they actually reduced exposure overall by trimming longs by -2.2k contracts (-4.1%) and shorts by 844 contracts (-0.8%)
- Asset managers increased net-short exposure by 6k contracts, reducing 5.5k long contracts (+11.3%) and increasing shorts by 554 contracts (0.5%)
AUD/USD technical analysis
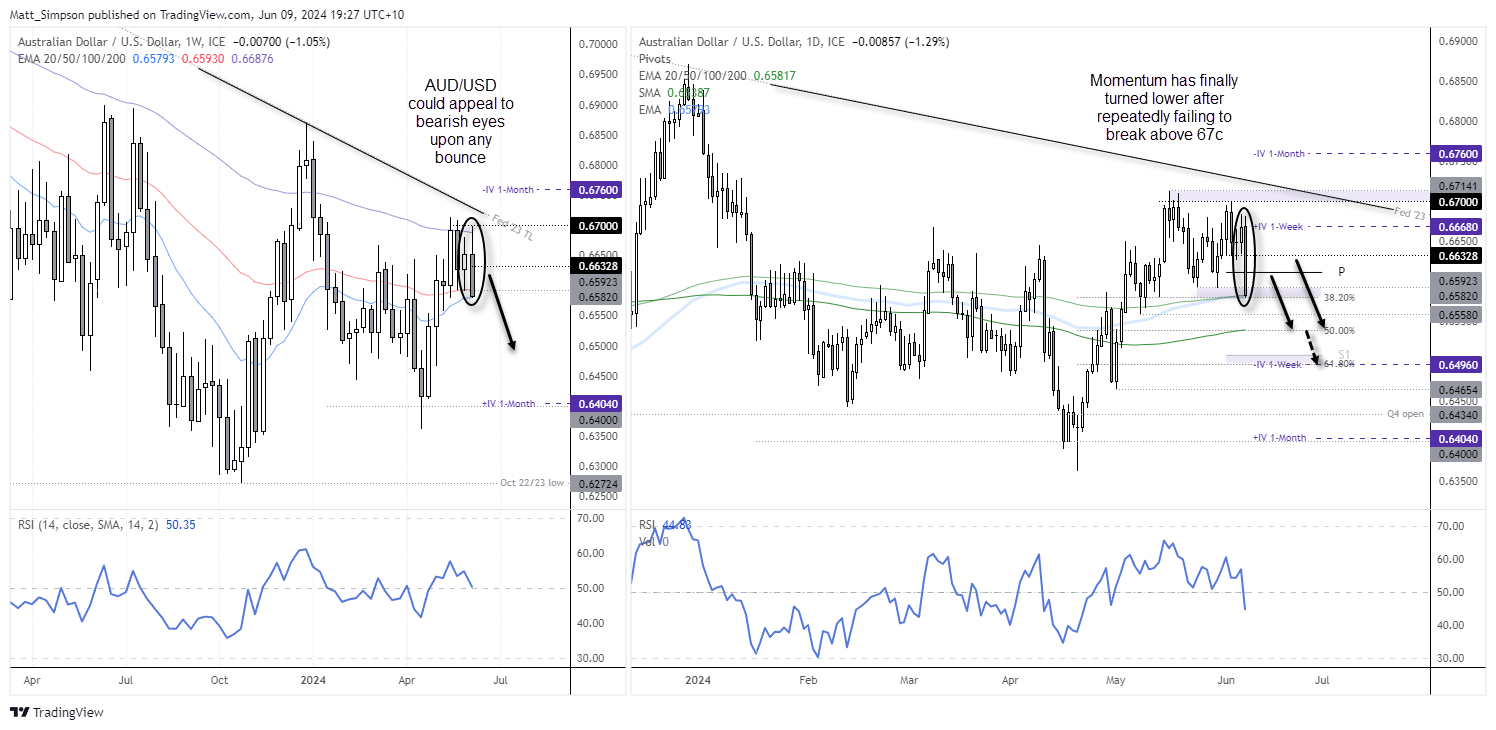
The Australian dollar rolled over almost perfectly at 67c, near the 100-week EMA and formed a bearish engulfing/outside week. AUD/USD also saw a weekly close beneath the 50-week EMA, although it is trying to hold above the 20-week EMA. The selloff did not come without warning, after it twice failed to close above 67c over the prior three weeks. The weekly RSI (14) is on the cusp of falling below 50.
The severity of Friday’s selloff is apparent on the daily chart, with a clear close below the prior week’s lows. Although it was the 200-day EMA which came to the rescue alongside the 20-week EMA, with a 38.2% Fibonacci level also providing a helping hand. AUD/USD is likely to appeal to bearish swing traders should it manage to bounce from current levels, with the monthly pivot point (0.6612) and consolidation lows (0.6632) making potential resistance areas for bears to consider fading into.
The 200-day EMA and 50% retracement level around 0.6558 is the next support level should prices break beneath Friday’s low. Bears could then target 0.6500 near the monthly S2 and 61.8% Fibonacci level should the US dollar continue to strengthen.
-- Written by Matt Simpson
Follow Matt on Twitter @cLeverEdge
How to trade with City Index
You can trade with City Index by following these four easy steps:
- Open an account, or log in if you’re already a customer
• Open an account in the UK
• Open an account in Australia
• Open an account in Singapore
- Search for the market you want to trade in our award-winning platform
- Choose your position and size, and your stop and limit levels
- Place the trade
Related tags:


Open an account in minutes
Experience award-winning platforms with fast and secure execution, and enjoy tight spreads from 0.5 pts on FX and 0.3 pts on indices.
Economic calendar
Web Trader platform
Our sophisticated web-based platform is packed with features.
Related articles

Japanese Yen Forecast: USD/JPY 4% Rally Challenges Post-Intervention Downtrend 9 24 2026
USD/JPY momentum has shifted sharply higher, putting a major resistance confluence in focus as U.S. and Japanese event risk builds.


Oil Quietly Hands the Fed a Reason to Stay Hawkish
Oil prices and the U.S. dollar are both on the front foot as elevated energy costs feed Fed warnings that inflation may prove sticky.


USD/JPY outlook: Hawkish Fed recalibration pressures the yen
Stronger US growth momentum and rising Treasury yields are keeping USD/JPY pointed higher, even as Japanese policymakers try to limit the pressure building across domestic markets.

This report is intended for general circulation only. It should not be construed as a recommendation, or an offer (or solicitation of an offer) to buy or sell any financial products. The information provided does not take into account your specific investment objectives, financial situation or particular needs. Before you act on any recommendation that may be contained in this report, independent advice ought to be sought from a financial adviser regarding the suitability of the investment product, taking into account your specific investment objectives, financial situation or particular needs.
StoneX Financial Pte. Ltd., may distribute reports produced by its respective foreign entities or affiliates within the StoneX group of companies or third parties pursuant to an arrangement under Regulation 32C of the Financial Advisers Regulations. Where the report is distributed to a person in Singapore who is not an accredited investor, expert investor or an institutional investor (as defined in the Securities Futures Act), StoneX Financial Pte. Ltd. accepts legal responsibility to such persons for the contents of the report only to the extent required by law. Singapore recipients should contact StoneX Financial Pte. Ltd. at 6826 9988 for matters arising from, or in connection with the report.
In the case of all other recipients of this report, to the extent permitted by applicable laws and regulations neither StoneX Financial Pte. Ltd. nor its associated companies will be responsible or liable for any loss or damage incurred arising out of, or in connection with, any use of the information contained in this report and all such liability is hereby expressly disclaimed. No representation or warranty is made, express or implied, that the content of this report is complete or accurate.
StoneX Financial Pte. Ltd. is not under any obligation to update this report.
Trading CFDs carries a high level of risk that may not be suitable for some investors. Consider your investment objectives, level of experience, financial resources, risk appetite and other relevant circumstances carefully. The possibility exists that you could lose some or all of your investments, including your initial deposits. If in doubt, please seek independent expert advice. Visit www.forex.com/en-sg/terms-and-policies for the complete Risk Disclosure Statement.