



AUDNZD recovery under review
Two months have passed since our last update (here) on the AUDNZD cross, one of our favourite trading pairs for 2019. The length of time between our updates reflects the holiday period. It also reflects a determination to let the dust settle after the RBNZ wrong-footed the market in mid-November and elected to keep interest rates on hold despite a consensus view they would cut rates.
Share this:

Two months have passed since our last update (here) on the AUDNZD cross, one of our favourite trading pairs for 2019.
The length of time between our updates reflects the holiday period. It also reflects a determination to let the dust settle after the RBNZ wrong-footed the market in mid-November and elected to keep interest rates on hold despite a consensus view they would cut rates.
“For now, the sensible course of action in AUDNZD is to allow the market time to stabilise and look for signs of a base to form over the coming weeks.”
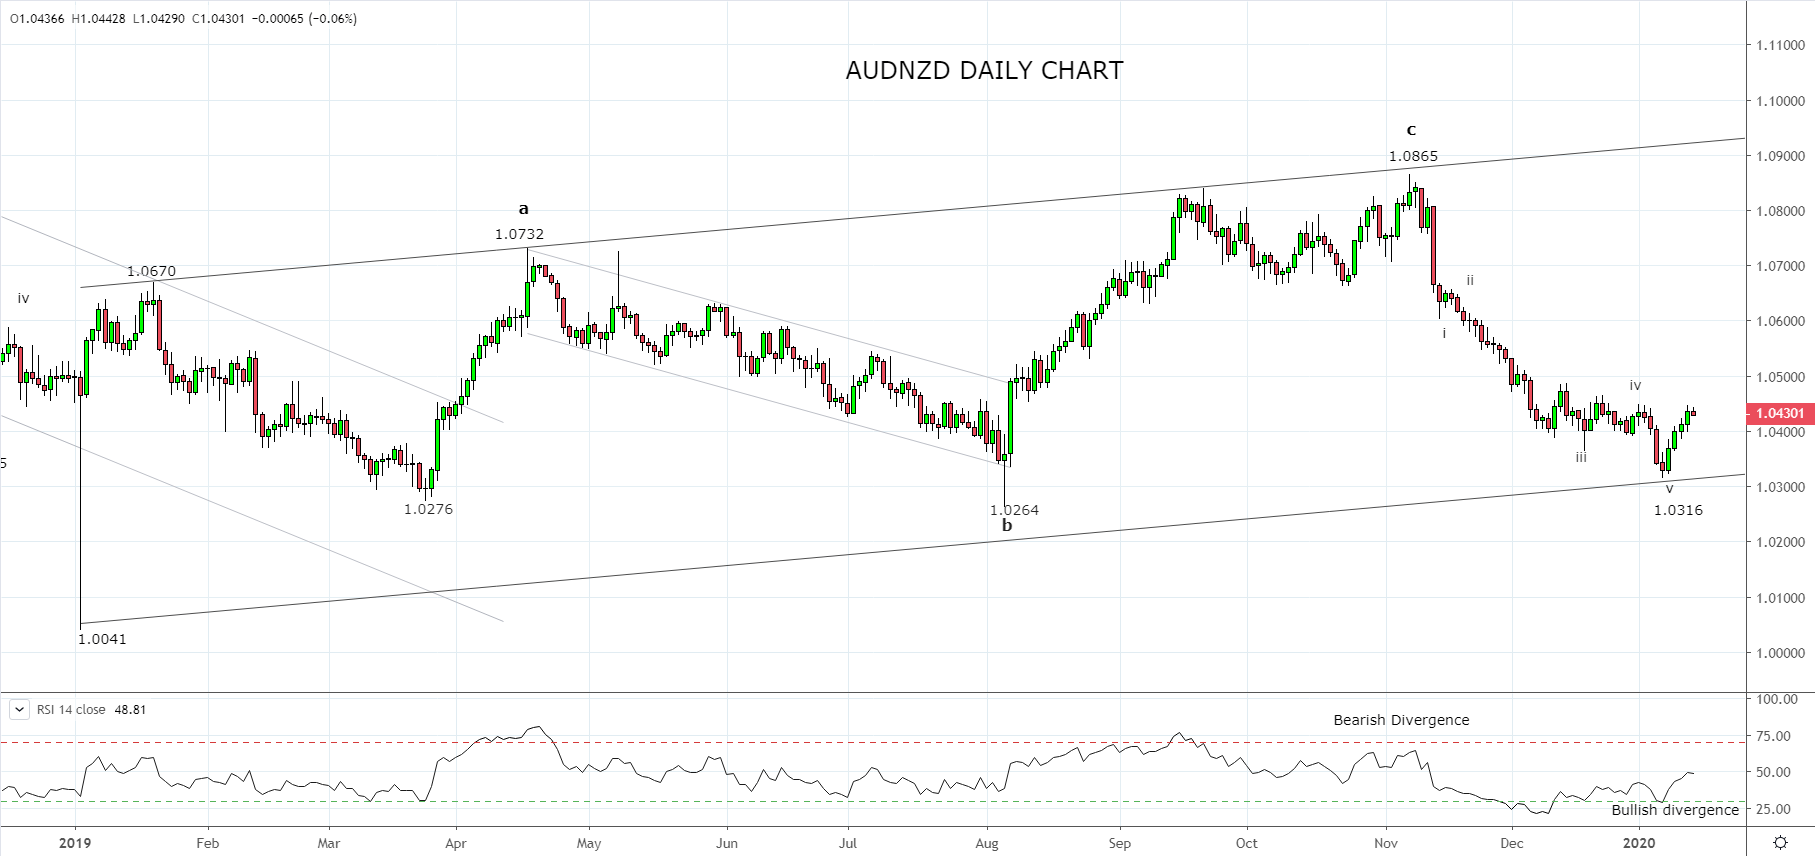
Since that point, AUDNZD has fallen over 300 points, from 1.0650 to near 1.0300 as the market unwound its long positions, seemingly exacerbated by the natural disasters currently impacting multiple regions in Australia. The impact of the bushfires on economic activity remains uncertain, more so as there is sadly a high risk of further fire damage in the coming weeks.
Economists expect the fires to result in a hit to growth in the March quarter of around -0.5% centred in the agricultural and tourism sectors before a rebuilding boost in the June quarter. Typically markets tend to look through both the negative print and the rebound caused by “one-off” natural disaster type disruptions.
Also relevant to the cross rate, AUDNZD completed a five wave decline from the 1.0865 high at the long term trend channel support ahead of 1.0300. Combined with the bullish divergence as viewed on the RSI indicator, the stage was set last week for a bounce to commence, following the better than expected housing approvals and strongest retail sales numbers in two years.
For those that took advantage of the set up there appears to be room for the rebound to continue towards 1.0500/50. However, I do feel that the easy money from this countertrend rally is now mostly gone and if at any time the trendline support at 1.0315 and 2019 lows 1.0275/65 give way, the next leg of the downtrend is likely to have commenced, targeting a retest of the 2019 flash crash low near 1.0040.
Source Tradingview. The figures stated areas of the 15th of January 2020. Past performance is not a reliable indicator of future performance. This report does not contain and is not to be taken as containing any financial product advice or financial product recommendation
Related tags:
Latest market news




Open an account in minutes
Experience award-winning platforms with fast and secure execution, and enjoy tight spreads from 0.5 pts on FX and 0.3 pts on indices.
Economic calendar
Web Trader platform
Our sophisticated web-based platform is packed with features.
Related articles
Japanese Yen Forecast: USD/JPY 4% Rally Challenges Post-Intervention Downtrend 9 24 2026
USD/JPY momentum has shifted sharply higher, putting a major resistance confluence in focus as U.S. and Japanese event risk builds.

Oil Quietly Hands the Fed a Reason to Stay Hawkish
Oil prices and the U.S. dollar are both on the front foot as elevated energy costs feed Fed warnings that inflation may prove sticky.


USD/JPY outlook: Hawkish Fed recalibration pressures the yen
Stronger US growth momentum and rising Treasury yields are keeping USD/JPY pointed higher, even as Japanese policymakers try to limit the pressure building across domestic markets.

This report is intended for general circulation only. It should not be construed as a recommendation, or an offer (or solicitation of an offer) to buy or sell any financial products. The information provided does not take into account your specific investment objectives, financial situation or particular needs. Before you act on any recommendation that may be contained in this report, independent advice ought to be sought from a financial adviser regarding the suitability of the investment product, taking into account your specific investment objectives, financial situation or particular needs.
StoneX Financial Pte. Ltd., may distribute reports produced by its respective foreign entities or affiliates within the StoneX group of companies or third parties pursuant to an arrangement under Regulation 32C of the Financial Advisers Regulations. Where the report is distributed to a person in Singapore who is not an accredited investor, expert investor or an institutional investor (as defined in the Securities Futures Act), StoneX Financial Pte. Ltd. accepts legal responsibility to such persons for the contents of the report only to the extent required by law. Singapore recipients should contact StoneX Financial Pte. Ltd. at 6826 9988 for matters arising from, or in connection with the report.
In the case of all other recipients of this report, to the extent permitted by applicable laws and regulations neither StoneX Financial Pte. Ltd. nor its associated companies will be responsible or liable for any loss or damage incurred arising out of, or in connection with, any use of the information contained in this report and all such liability is hereby expressly disclaimed. No representation or warranty is made, express or implied, that the content of this report is complete or accurate.
StoneX Financial Pte. Ltd. is not under any obligation to update this report.
Trading CFDs carries a high level of risk that may not be suitable for some investors. Consider your investment objectives, level of experience, financial resources, risk appetite and other relevant circumstances carefully. The possibility exists that you could lose some or all of your investments, including your initial deposits. If in doubt, please seek independent expert advice. Visit www.forex.com/en-sg/terms-and-policies for the complete Risk Disclosure Statement.