




British Pound Technical Analysis: GBP/USD Reverses into Rally
GBP/USD is breaking out to start the week, begging the question as to whether we’re seeing a reversal in larger USD markets or whether it’s a pullback in a still-shifting trend.
Share this:

GBP/USD, British Pound Talking Points:
- I’ve been tracking GBP/USD for USD-weakness scenarios lately and I went over a setup in last week’s webinar that remains relevant today.
- At issue last week was a run of USD-strength, and as I had highlighted this brought into play a key zone of support in GBP/USD. That zone has held the lows and pushed into a bullish reversal that’s now pushed above the 1.3500 psychological level.
- I look into GBP/USD during each weekly webinar and you’re welcome to join the next. Click here to register.
USD bulls had an open door to make a move last week, especially after the CPI report on Tuesday. That move extended through Wednesday morning until President Trump again threatened to fire Jerome Powell, which helped to dent the rally. USD buyers weren’t necessarily done for at that point as they pressed back into the highs a day later; but that’s where U.S. Dollar strength has so far ceased to continue, and to start this week, the Dollar continues to pullback and that’s helping to perk up multiple major pairs, GBP/USD included.
GBP/USD remains of interest as the pair came in to test a significant support zone last week. I looked at the setup before it came into play during the Tuesday webinar, highlighting the 1.3395-1.3414 support zone. I even showed how I wanted buyers to respond which ended up showing, as they quickly came into bid a test below the zone, which then led to slightly higher-lows. And now to start the week we have fresh higher-highs and that’s opening the door to bullish continuation scenarios in the pair.
GBP/USD Four-Hour Price Chart
Chart prepared by James Stanley; data derived from Tradingview
GBP/USD Bigger Picture
The question now is whether USD bulls can continue to push and from a shorter-term perspective, there’s some resistance to contend with sitting overhead; and there’s also the matter of the 1.3500 level to contend with as the pair is now trading above that price. This can make for a difficult backdrop to chase as there’s still not much for convincing evidence that the pair has gained acceptance above that price, so pullbacks can remain an attractive way of working with the move. For that, there’s a prior swing of resistance to support at 1.3466 and another at 1.3441, both of which would constitute a higher-low above the early-week low in the pair.
GBP/USD Two-Hour Chart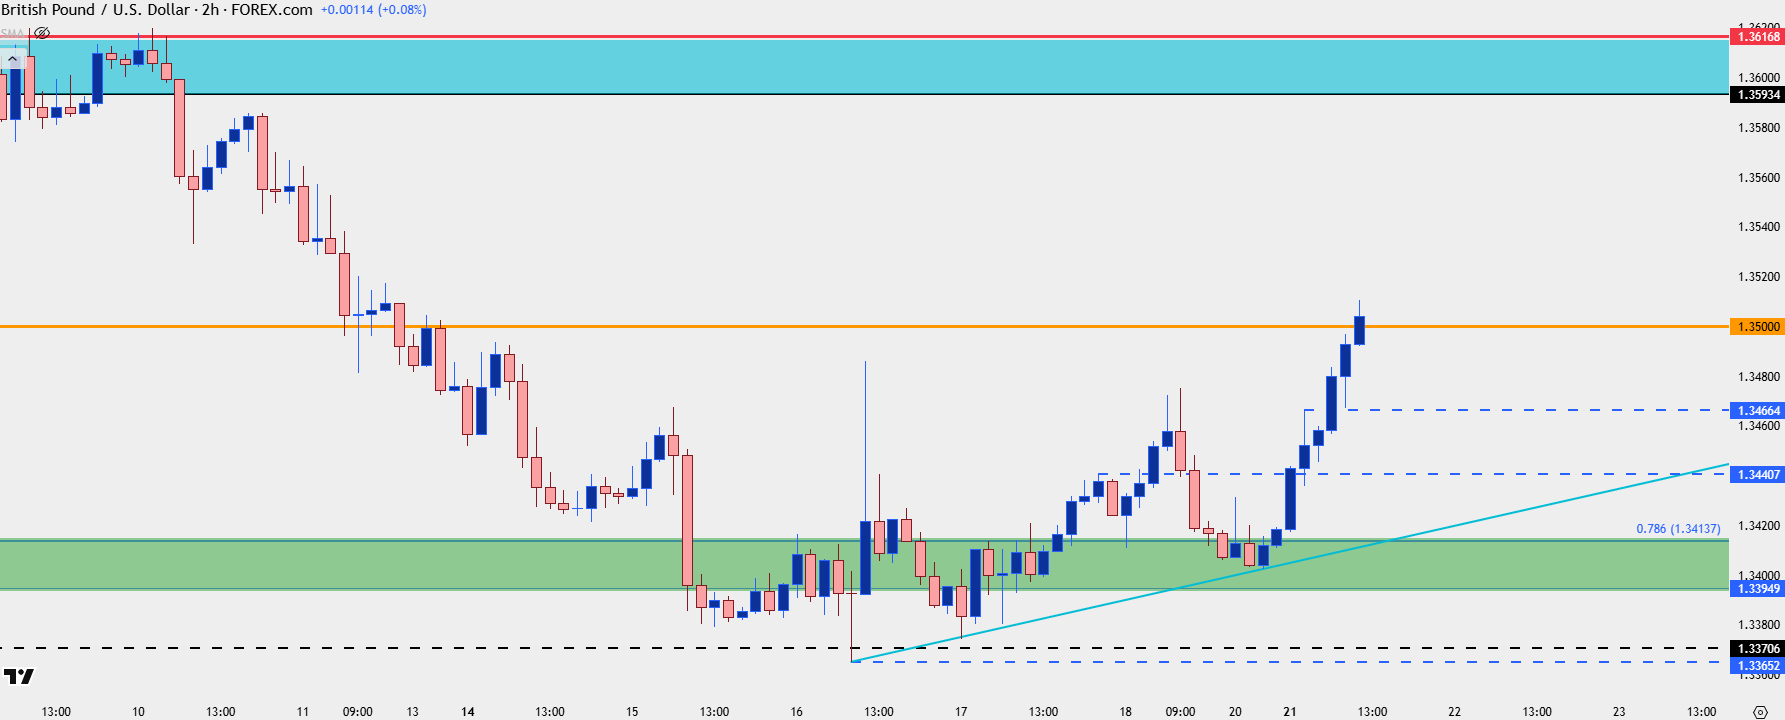
Chart prepared by James Stanley; data derived from Tradingview
GBP/USD Daily Chart
For the past couple of months GBP/USD has been mean-reverting and the support that was in-play last week is the same that was in-play in late-June. This also highlights some additional levels and zones of interest, such as the 1.3500 level looked at above, or the 1.3593-1.3617 zone that sits overhead. That would be the next resistance for buyers to contend with if they can continue to stretch the short-term bullish move.
GBP/USD Daily Chart
Chart prepared by James Stanley; data derived from Tradingview
--- written by James Stanley, Senior Strategist
Related tags:




Open an account in minutes
Experience award-winning platforms with fast and secure execution, and enjoy tight spreads from 0.5 pts on FX and 0.3 pts on indices.
Economic calendar
Web Trader platform
Our sophisticated web-based platform is packed with features.
Related articles

GBP/USD, DJIA Outlook: Support Levels Meet Oversold Risks
GBP/USD and the Dow test key support levels as rising Treasury yields, Fed rate-hike expectations and oversold momentum increase reversal risks.


USD/JPY Bulls Continue to Push as Markets ‘Bet Against the House’
USD/JPY is now up by more than 500 pips from the low taken the day that Scott Bessent taunted markets, saying ‘you can bet against me if you want.’

GBP/USD forecast: US dollar surges as bonds implode
The US dollar continued to press higher deep into the European session, supported by the slump in the bond markets as yields broke out across the curve. Following the recent hawkish Fed rate hike, yield spreads between the US and the rest of the world has continually increased, and that motion continued today, helped in part by some forecast-beating US macro data and hawkish Fed commentary.

This report is intended for general circulation only. It should not be construed as a recommendation, or an offer (or solicitation of an offer) to buy or sell any financial products. The information provided does not take into account your specific investment objectives, financial situation or particular needs. Before you act on any recommendation that may be contained in this report, independent advice ought to be sought from a financial adviser regarding the suitability of the investment product, taking into account your specific investment objectives, financial situation or particular needs.
StoneX Financial Pte. Ltd., may distribute reports produced by its respective foreign entities or affiliates within the StoneX group of companies or third parties pursuant to an arrangement under Regulation 32C of the Financial Advisers Regulations. Where the report is distributed to a person in Singapore who is not an accredited investor, expert investor or an institutional investor (as defined in the Securities Futures Act), StoneX Financial Pte. Ltd. accepts legal responsibility to such persons for the contents of the report only to the extent required by law. Singapore recipients should contact StoneX Financial Pte. Ltd. at 6826 9988 for matters arising from, or in connection with the report.
In the case of all other recipients of this report, to the extent permitted by applicable laws and regulations neither StoneX Financial Pte. Ltd. nor its associated companies will be responsible or liable for any loss or damage incurred arising out of, or in connection with, any use of the information contained in this report and all such liability is hereby expressly disclaimed. No representation or warranty is made, express or implied, that the content of this report is complete or accurate.
StoneX Financial Pte. Ltd. is not under any obligation to update this report.
Trading CFDs carries a high level of risk that may not be suitable for some investors. Consider your investment objectives, level of experience, financial resources, risk appetite and other relevant circumstances carefully. The possibility exists that you could lose some or all of your investments, including your initial deposits. If in doubt, please seek independent expert advice. Visit www.forex.com/en-sg/terms-and-policies for the complete Risk Disclosure Statement.