
U.S. Dollar Talking Points:
- It was a chaotic week in the USD, but it didn’t start that way. Initially the USD broke out of a falling wedge formation and had a rather clean bullish run, helped along by a CPI report on Tuesday. But then a threat from President Trump to fire Jerome Powell brought a massive short-term reversal in the currency and related major FX pairs.
- The comment was walked back shortly after and I said in the webinar the day before, I expected a threat of that nature to appear in response to USD, but I also said that I don’t think Trump actually wants to fire Powell.
- Next week sees the Fed go into a blackout window ahead of the July rate decision, and the big question now is whether the Fed starts to lay the groundwork for a rate cut at the September meeting.
- I’ll be looking at updated charts for each of these markets in the webinar on Tuesday and you’re welcome to join: Click here to register.
U.S. Dollar
The USD started the week with a clean breakout above a major spot of resistance from prior support, which also showed a bullish reversal from a falling wedge formation. On Tuesday, buyers were continuing to press the move but as I said in the webinar, it was still early, and the ultimate test of trend isn’t what happens when things are easy (trend side moves), it’s what happens when trends are in a harder space (counter-trend corrections).
By that standard, USD bulls have so far put in a strong show, responding to supports even as some pensive drivers appeared. On Wednesday, a circulating rumor indicated that President Trump was set to fire Jerome Powell. I had warned of that in the webinar the day before, largely in response to the USD breakout. In short order the USD had sold off and major FX pairs had started to reverse, but that report was walked back shortly after and USD bulls went back to work. It’s been higher-lows since then and as shown in the video, I think bulls have an open door to continue the rally. That said – there are a couple of markets that can remain as more attractive for USD-weakness, which I will look at below.
U.S. Dollar Daily Price Chart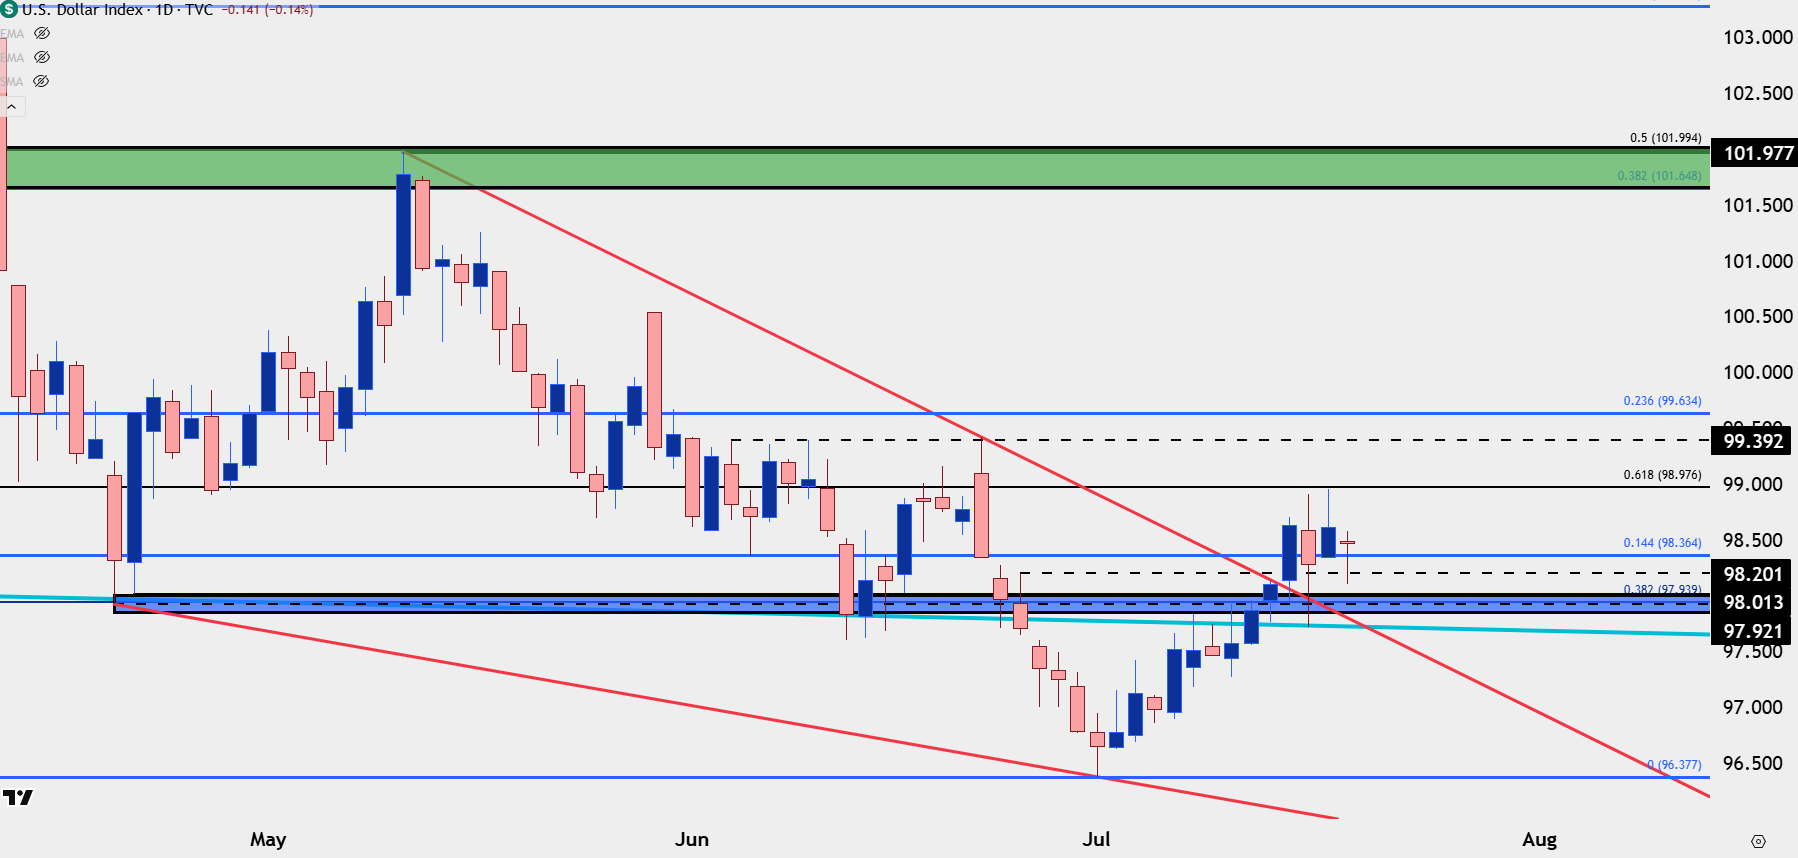
Chart prepared by James Stanley; data derived from Tradingview
EUR/USD
EUR/USD bears have had an open door to run but, so far, they haven’t shown much when given the opportunity to press fresh lows.
The Friday pullback in the pair held resistance at a key level – the same 1.1663 level that had set support in the prior week, and there’s more context for resistance a little higher, around the 1.1686 Fibonacci level. I think this is one of the more attractive major pairs for USD-strength at the moment but if bears fail to defend 1.1748 then that perspective can shirt quickly.

EUR/USD Four-Hour Chart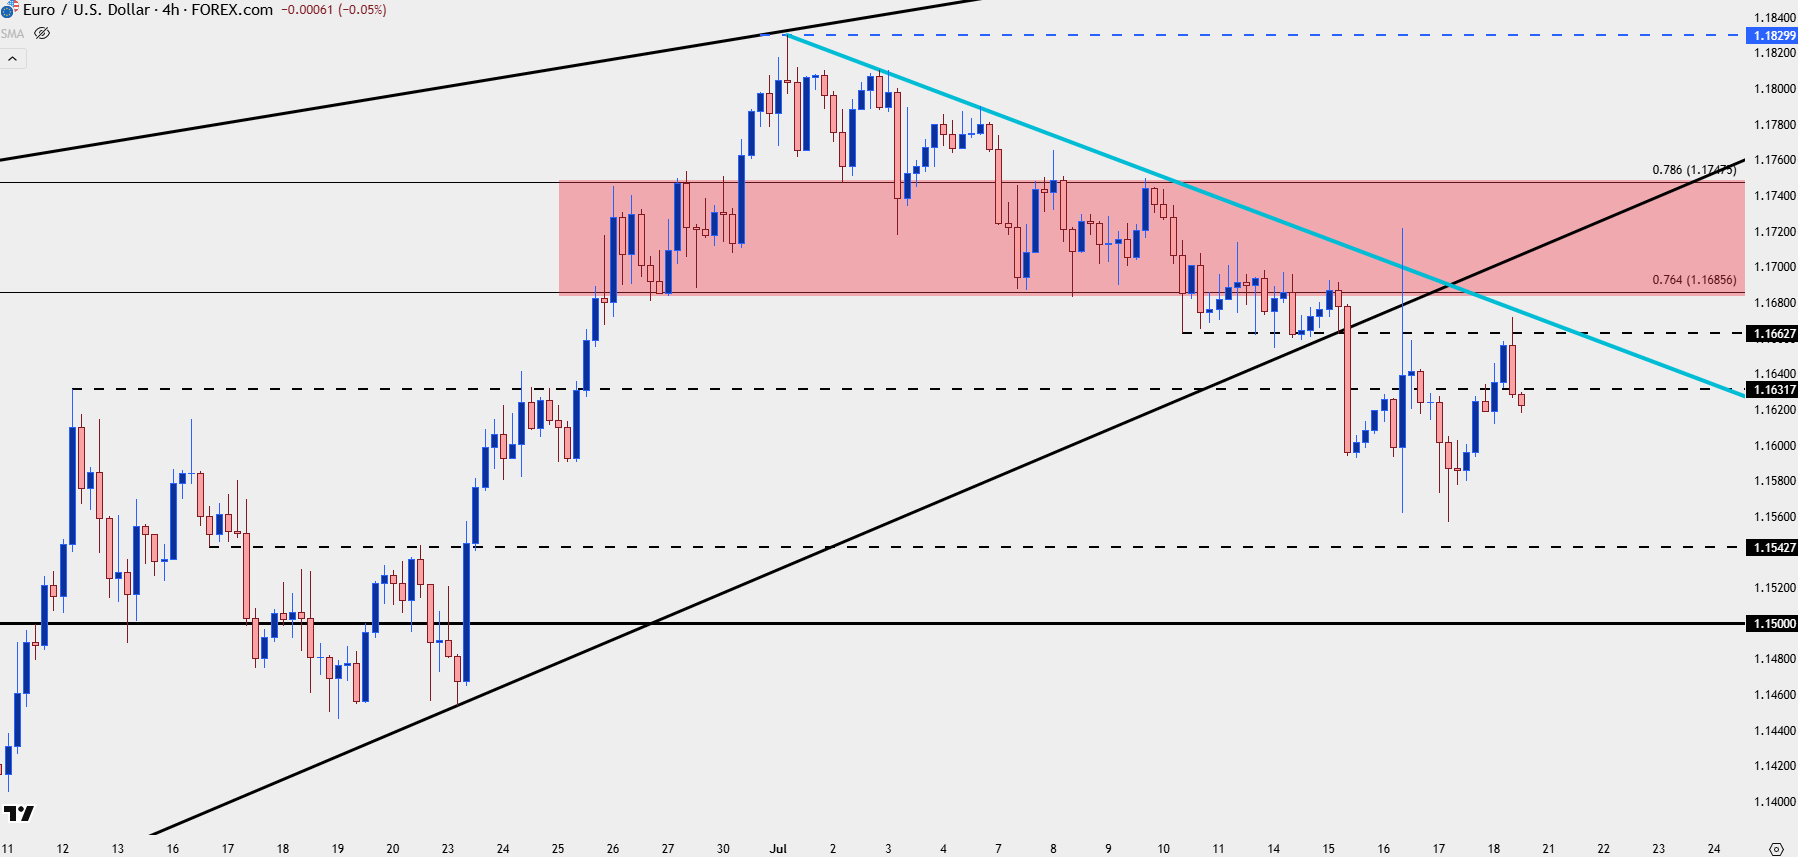
Chart prepared by James Stanley; data derived from Tradingview
GBP/USD
I looked at GBP/USD on Tuesday when USD-strength was driving, and at the time Cable looked as though it could lead into deeper breakdown. But, as I said then, for USD-weakness I still think this is one of the more attractive backdrops and since then, there’s been a strong reaction at that support zone that keeps the door open for bulls. And if we do see USD-weakness continue, I still think this could be one of the more compelling backdrops to work with that theme.
Of issue is the longer-term zone of resistance-turned-support, running from 1.3395-1.3414.
GBP/USD Four-Hour Chart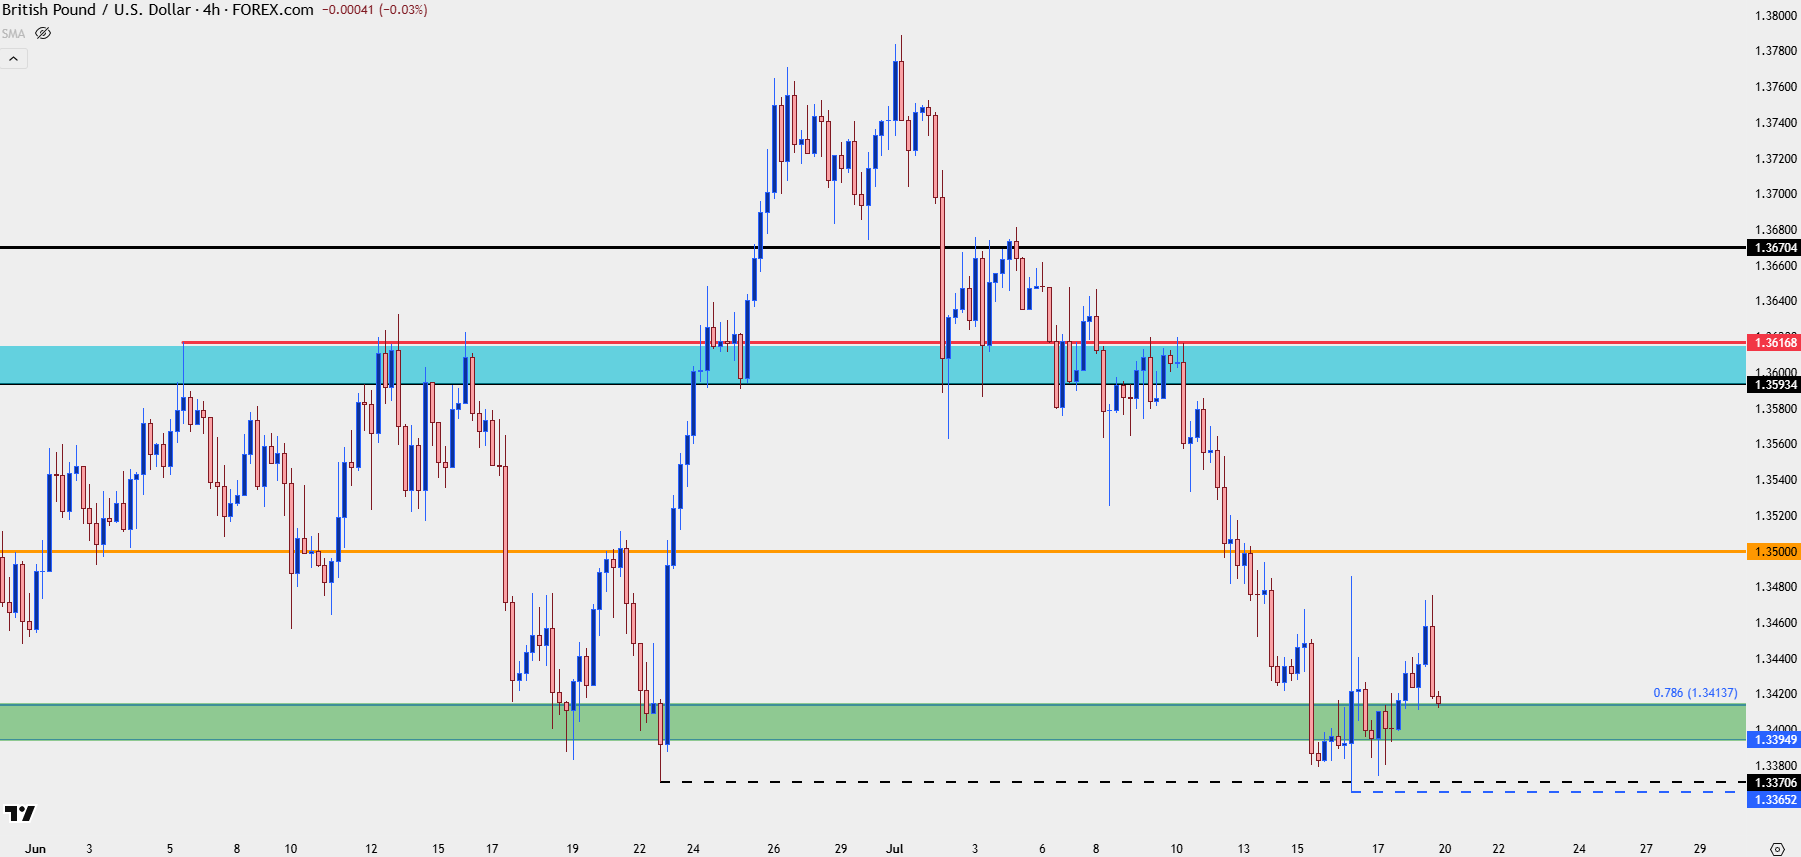
Chart prepared by James Stanley; data derived from Tradingview
USD/JPY
USD/JPY has been notoriously difficult on breakouts this year – in either direction – and as we wind towards the end of the week it appears as though bulls have an open door to push a topside breakout. The Wednesday pullback was aggressive, but since then, buyers have held support at higher-lows and around some key areas although bulls don’t yet look willing to test the resistance sitting overhead. The 150.00 obviously looms large but below that is the 200-day moving average which the pair hasn’t tested since mid-February.

USD/JPY Daily Price Chart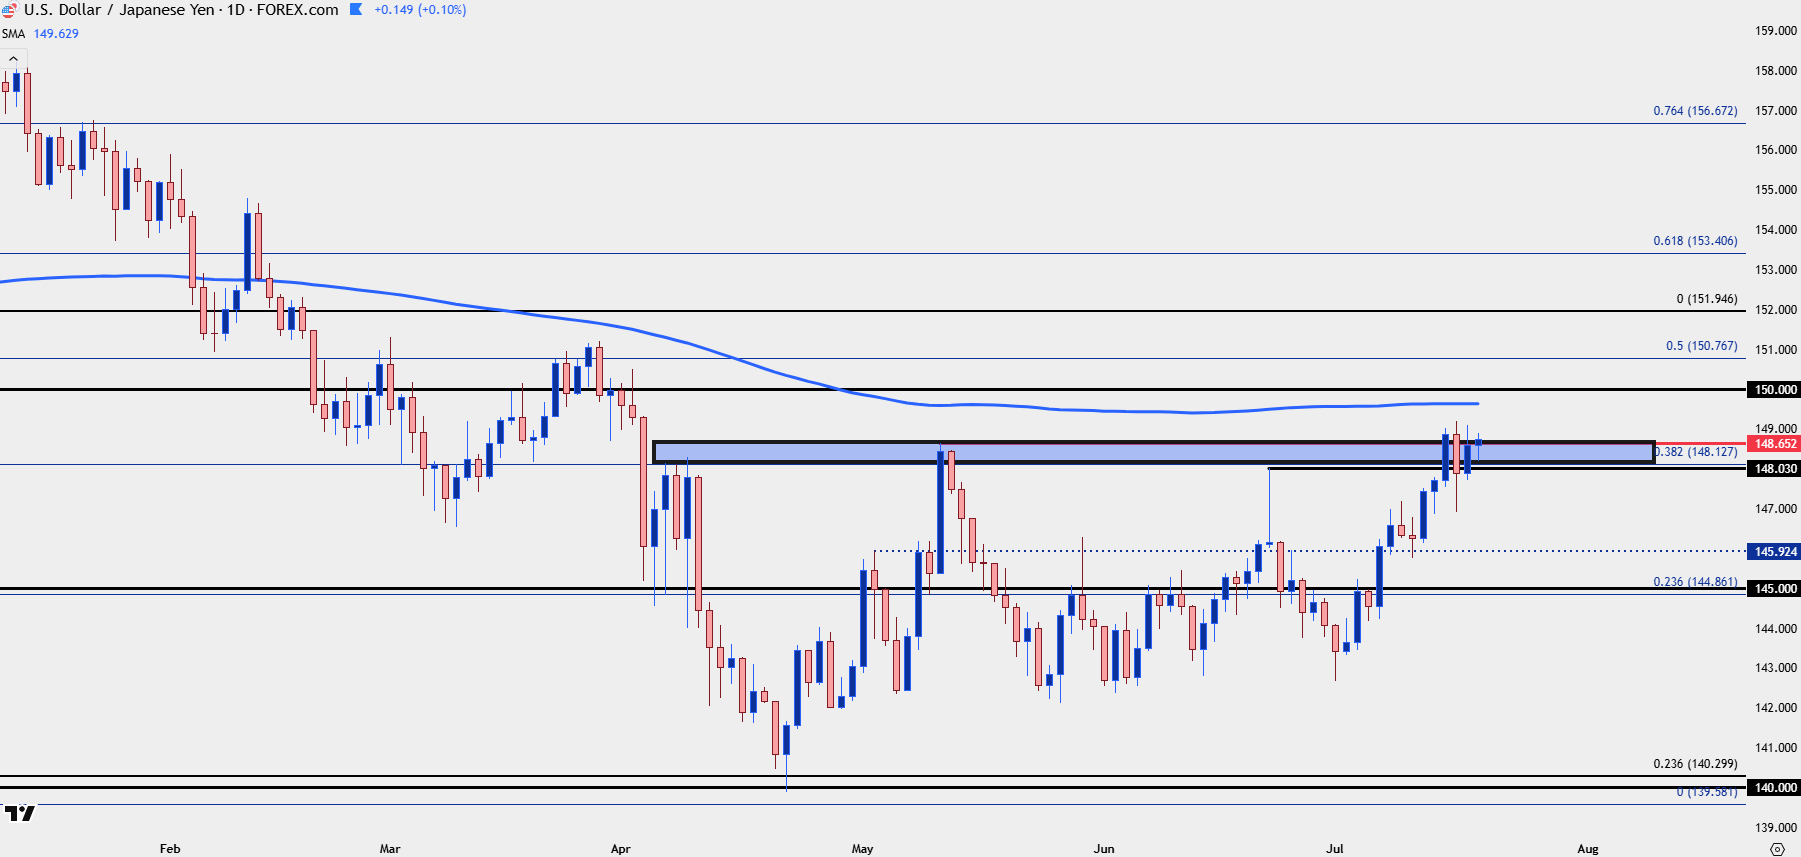
Chart prepared by James Stanley; data derived from Tradingview
USD/CAD
USD/CAD remains one of the backdrops for USD-weakness, largely due to the longer-term range; but even that pair looks like it could lead-in to USD-strength. Last week saw repeated testing at the 1.3679-1.3694 area, and that zone has since come in as support with price pushing up to next resistance at 1.3750, a major spot of resistance as taken from prior support. There’s deeper resistance potential at 1.3890-1.3905 and then again around the 1.4000 handle, both of which remain below the 200-day moving average which illustrates just how aggressively bears have been pushing since the breakdown back in April.
USD/CAD Daily Price Chart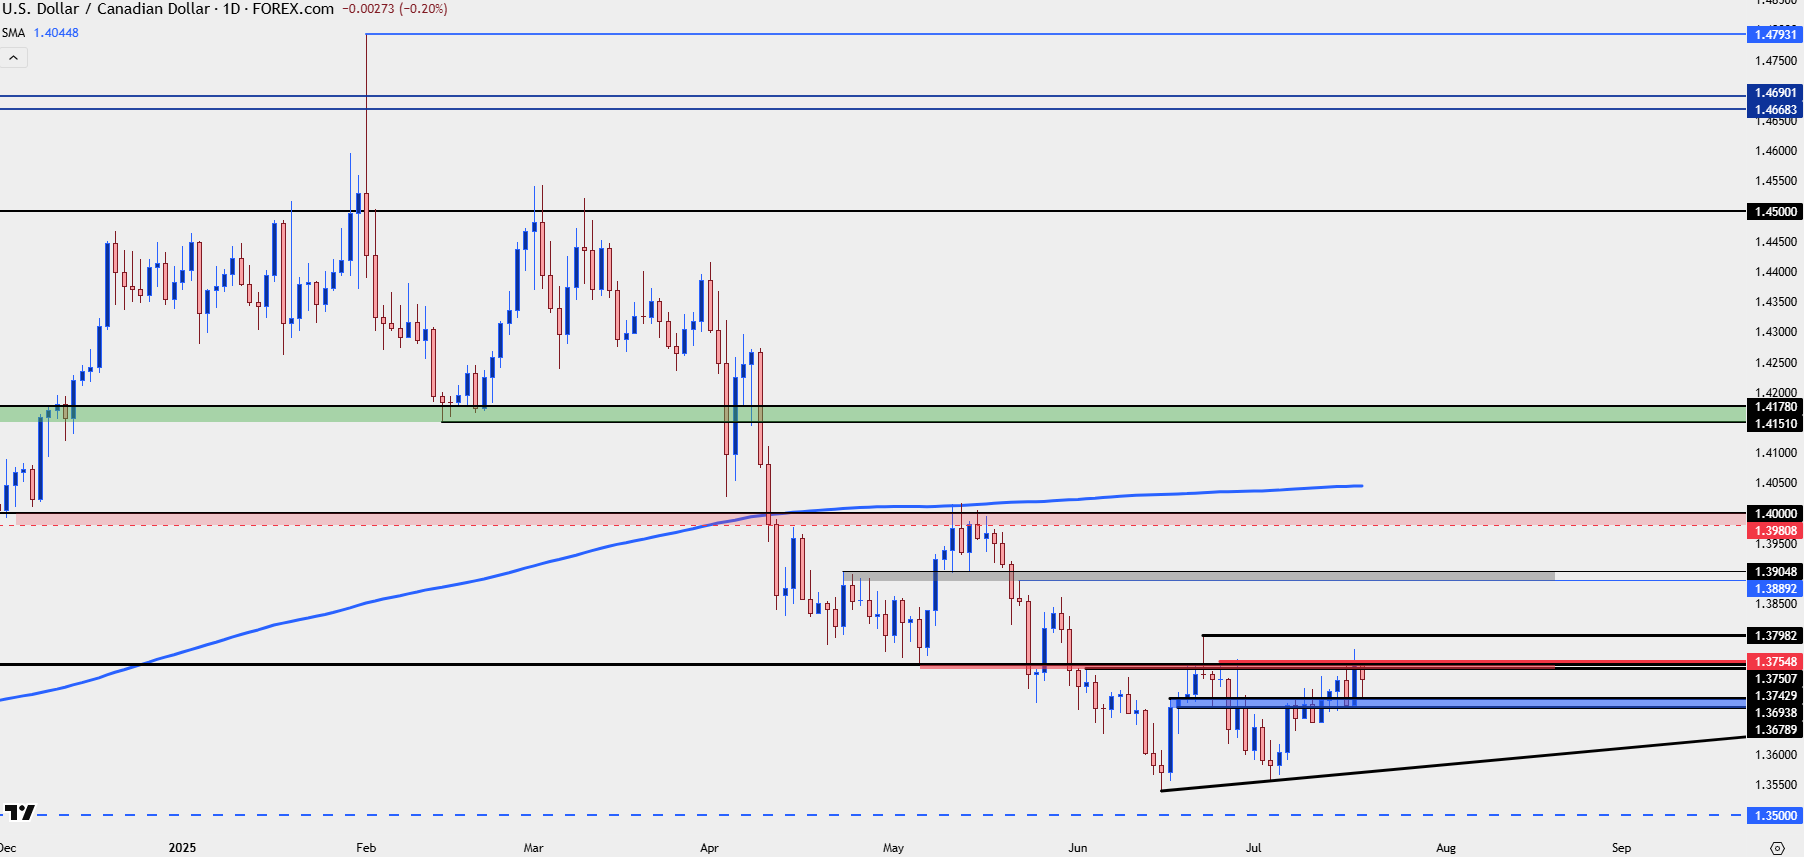
Chart prepared by James Stanley; data derived from Tradingview
--- written by James Stanley, Senior Strategist