
Euro, EUR/USD Talking Points:
- It’s been lower-lows and lower-high since the fresh three-year high on the first day of Q3, but sellers haven’t yet been able to make much of a mark below the Fibonacci level of 1.1686.
- The tariff topic has come screaming back into the headlines but EUR/USD looks remarkably calm around the matter. There’s also U.S. inflation to consider with the CPI release scheduled for tomorrow morning.
- I’ll be looking into both EUR/USD and USD after that CPI release in the weekly webinar. Click here to register.

EUR/USD sellers have had an open door to run a deeper pullback for a week now, and yet the pair continues to grasp on to Fibonacci support at the 1.1686 level. I had looked at that Fibonacci retracement in late-Q3 trade as those prices had started to come into play first as resistance, and then as support. The pair set a fresh three-year high on the first day of Q3 trade, after which profit taking appeared and short-term lower-lows and lower-highs developed.
But, after sellers pushed down for a test of 1.1686 last Monday, bears haven’t been able to make much progress since, and this has happened despite another rise in trade tensions between the two economies represented in the pair.
EUR/USD Daily Price Chart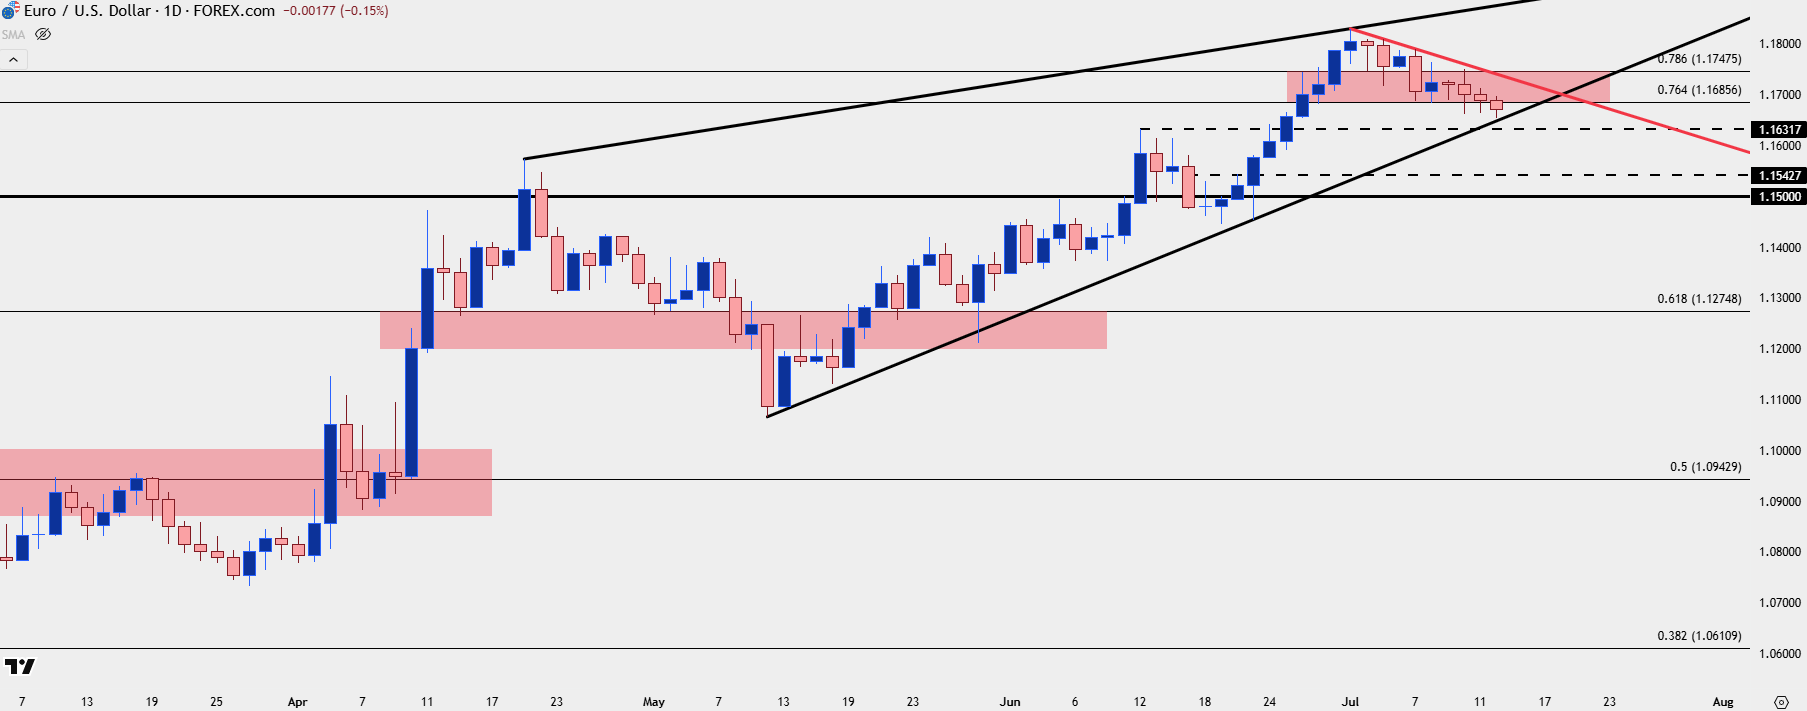
Chart prepared by James Stanley; data derived from Tradingview
EUR/USD Weekly
The levels in play come from a key Fibonacci retracement derived from the 2021-2022 major move. There’s been several inflections at those retracement levels since, such as the 2023 high at the 61.8% retracement or the range last year showing between 38.2 and 50% retracements. And then earlier this year, the 23.6% retracement came in to help catch the low in January and February before the massive reversal in March. Since then, the pair has stair-stepped along those levels up to the fresh three-year highs that were set two weeks ago; and at this point, we’re seeing the 76.4% retracement helping to hold bears at bay, at least for now.
EUR/USD Weekly Chart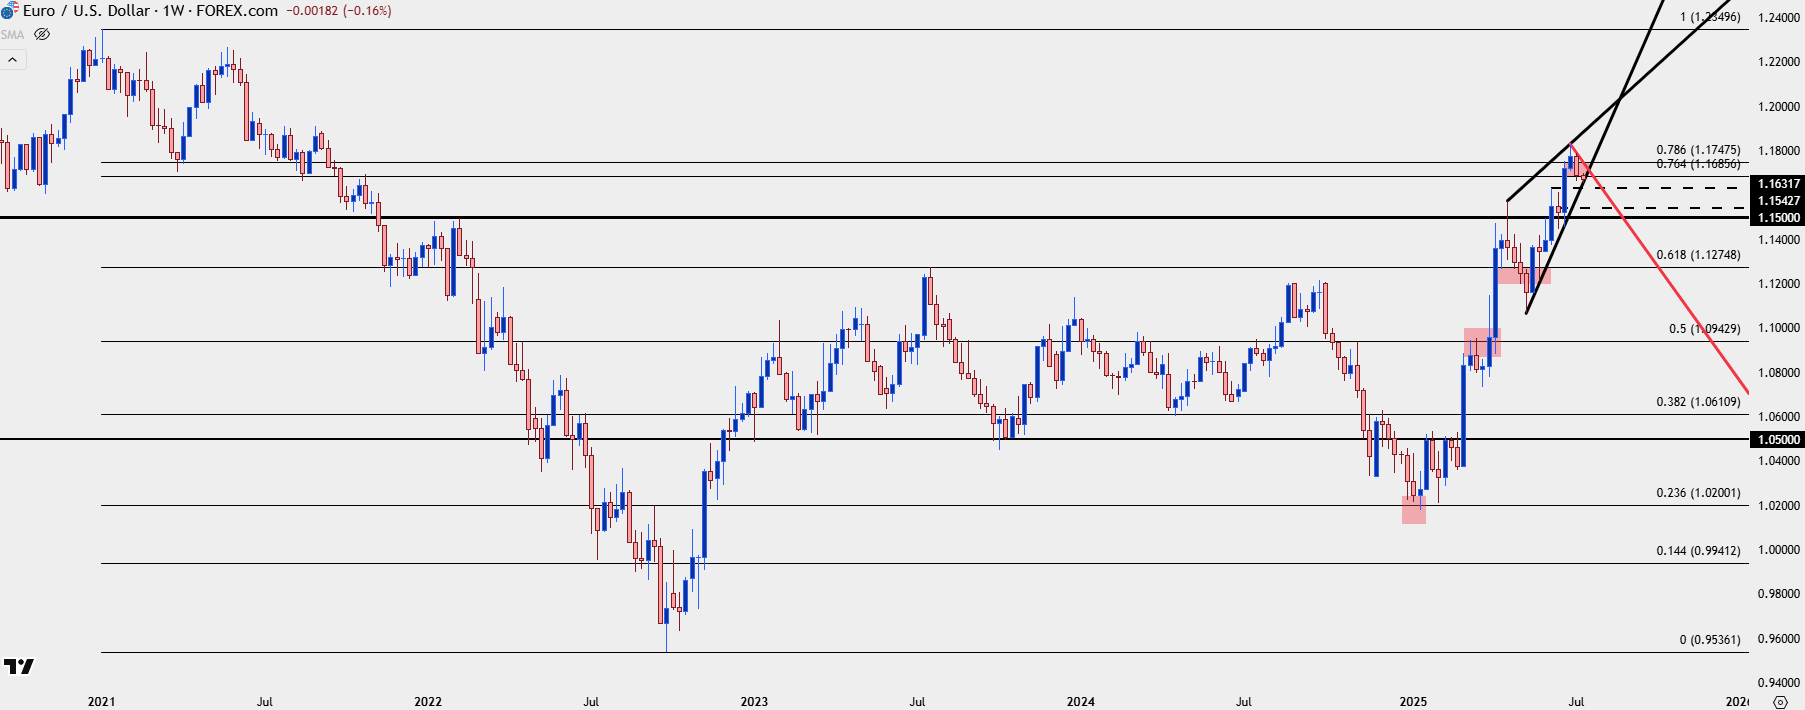
Chart prepared by James Stanley; data derived from Tradingview
EUR/USD Strategy
I looked into the pair last Tuesday in the weekly webinar and as I showed then, there was lower-high resistance potential at the 78.6% retracement, which held the highs a day later, which then led to a lower-low. And since that low, there’s been another lower-low after the start of trading this week, illustrating bearish potential that remains as of this writing.
But – the move has largely stalled as can be seen from the daily chart and that can be an item of note as bears have had an open door to run a deeper pullback but, so far, haven’t been able to do much with it. This points to the fact that they’re probably looking for another catalyst and tomorrow’s CPI report can very much be that item, particularly if we see inflation push back above a 3-handle in the U.S., which would bring to question the rate cuts that are priced in around the Fed into the end of this year.
While some Fed members are open to near-term cuts, such as Michelle Bowman or Christopher Waller, it seems that more of the Fed is cautious to cut for fear of stoking inflation around tariffs. Combine that with the possibility of increasing inflation already, and there could be even more question on rate cuts, which could lead to USD-strength as those softer rate probabilities get priced-out of markets.
From the four-hour chart, the lower-low and lower-high patterning remains clear, and this sets up a series of levels as we move towards tomorrow’s CPI report.
The prior lower-high at 1.1748, or the 78.6% retracement of that major move, is a big spot as this is the price that sellers ideally would defend for bearish continuation scenarios. But, that doesn’t necessarily mean home-free for bulls should that price get traded through, as the next operative question is whether bulls would be able to drive through the 1.1800 handle that they failed at in early-July. If they can elicit a closed body on the daily candle tomorrow, then bears would likely want to question downside potential in the pair.
On the underside of price, the same levels from last week’s webinar remain as deeper support potential, plotted at 1.1631 and 1.1543. Below that, the 1.1500 handle looms large and this is the price that longer-term traders would likely want to see sellers re-claim to get the idea that a larger sell-off may be afoot. Remember, that’s the price that stalled the advance back in April which led to a 400+ pip pullback into mid-May. And from the trendlines produced by the lows and highs of that move, there’s now a rising wedge formation in-play and if sellers show initiative – and prod that break below 1.1500, the door can open to a larger retracement backdrop in EUR/USD.
EUR/USD Four-Hour Chart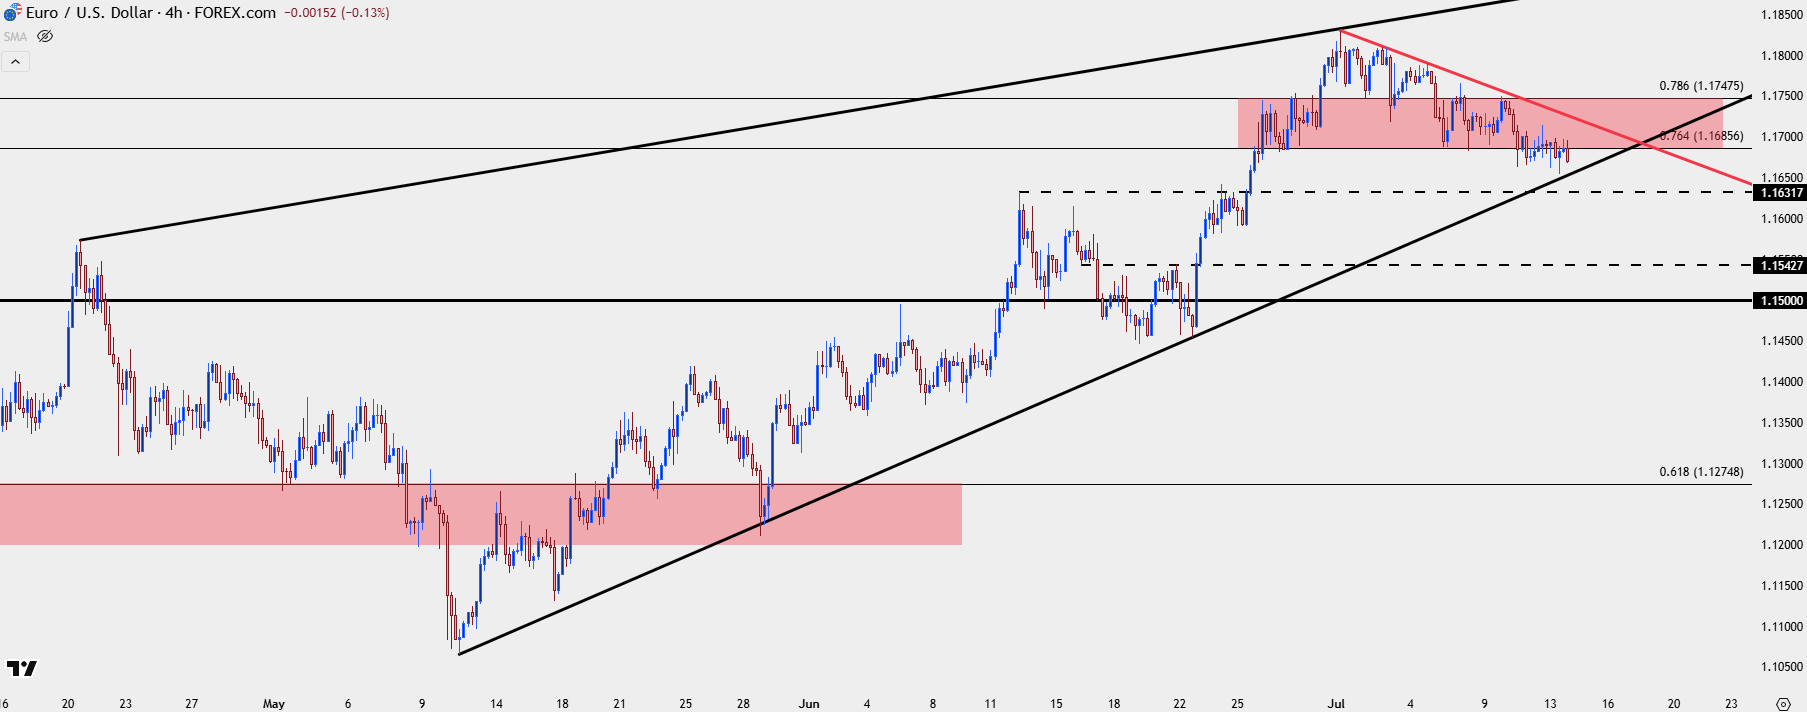
Chart prepared by James Stanley; data derived from Tradingview
--- written by James Stanley, Senior Strategist