





Canadian Data Continues to Disappoint
The headline retail sales number (MoM) was -1.2% vs expectations of +0.5%
Share this:

Canadian Retail Sales were released earlier today, and the results were disappointing. Although the data was for October, the data still matters. The headline retail sales number (MoM) was -1.2% vs expectations of +0.5% and -0.1% in September. This is the lowest headline number since November 2018. Core Retail Sales (MoM), which excludes autos, was -0.5%, vs +0.1% expected and a revised -0.1% data print from September.
The retail sales data continues a string of disappointing data from Canada. The Employment Change from November was -71,200 vs an expectation of 10,000. The Unemployment Rate also rose to 5.9% from 5.5% in October. In addition, manufacturing sales were -0.7% for October vs 0% expected. The Bank of Canada left rates unchanged at 1.75% at its December 4th meeting, however this new data will need to be considered when they meet again on January 22, 2020.
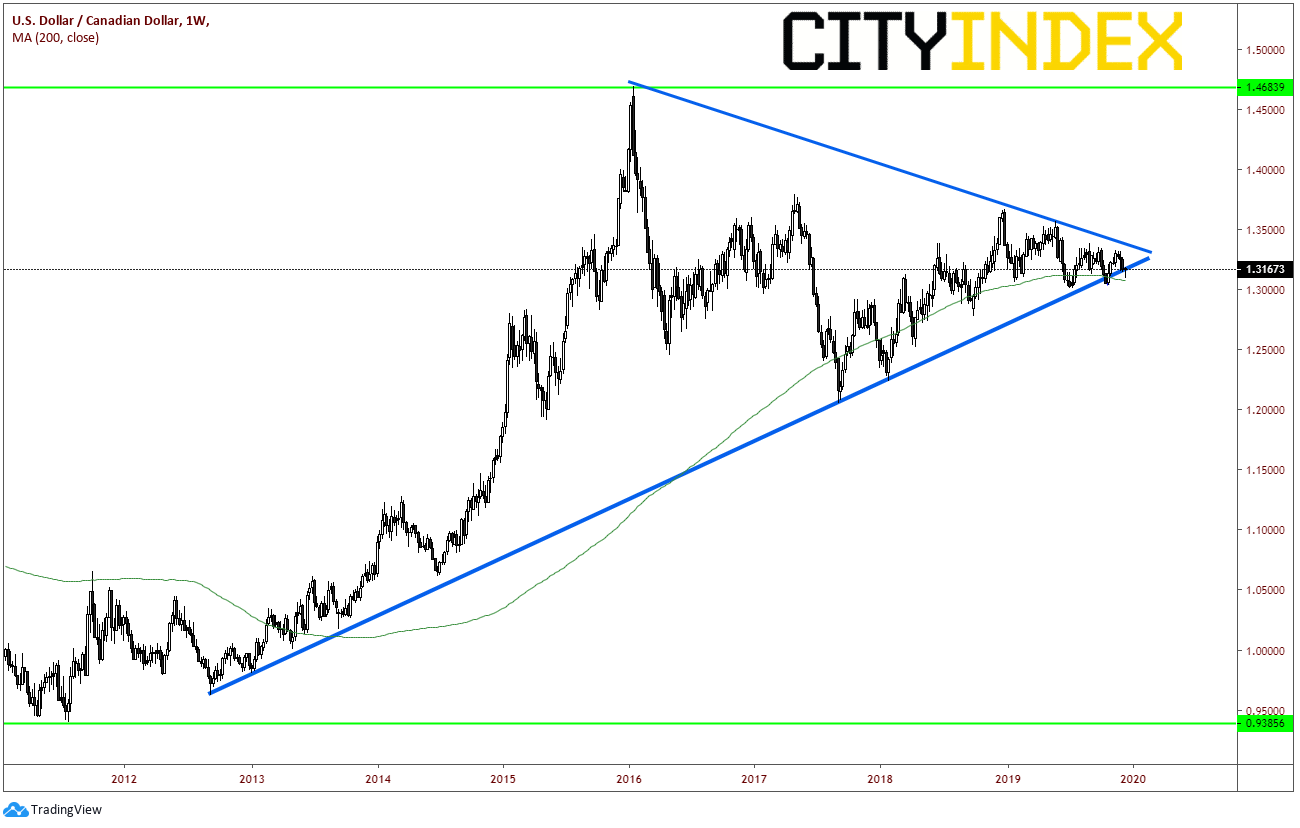
As we have written about previously, USD/CAD has been trading in a multi-year, symmetrical triangle and has been nearing the apex.
Source: Tradingview, City Index
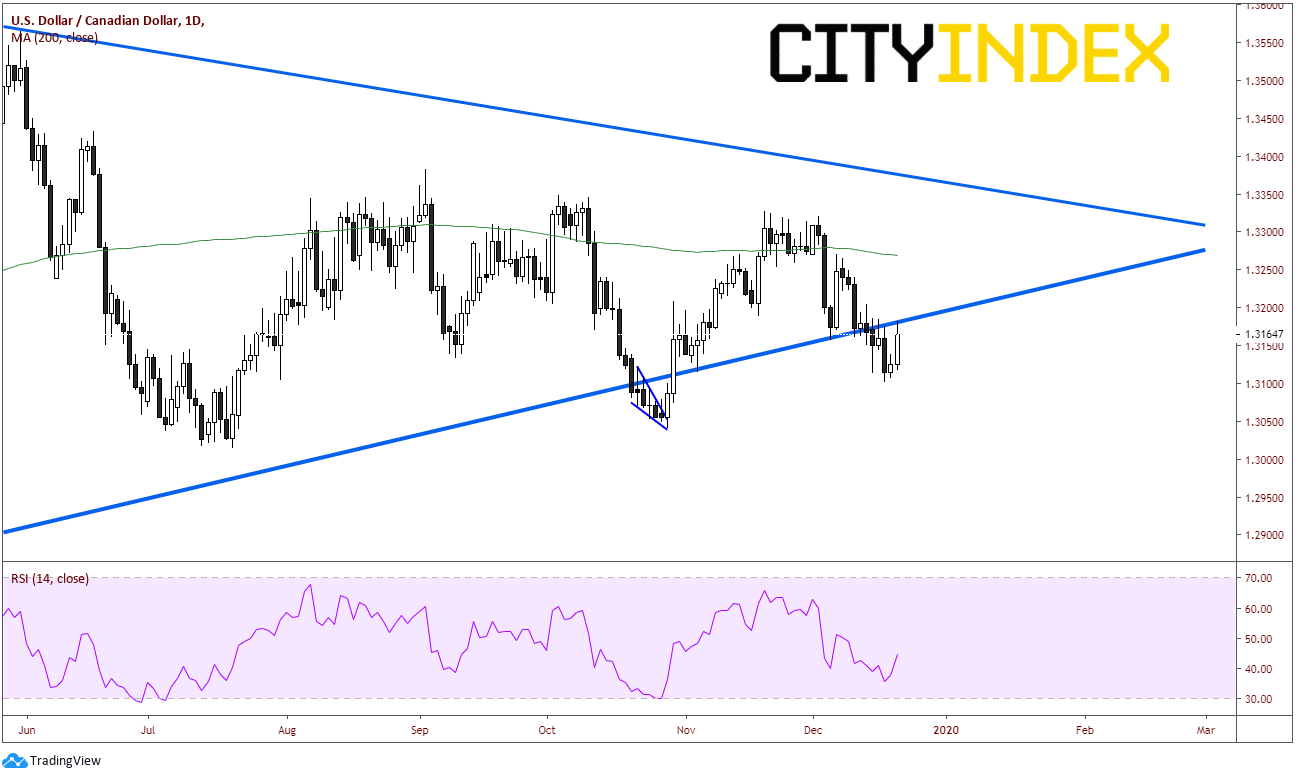
In October, price broke the rising, lower trendline of the triangle near 1.3050, only to trade back towards the 200 Day Moving Average near 1.3270, and squeeze as high as 1.3327, only to turn lower and back below the rising trendline. With today’s poor retail sales data, price has put in a long bullish white candle and price is currently trying to break back above the rising trendline at 1.3180.
Source: Tradingview, City Index
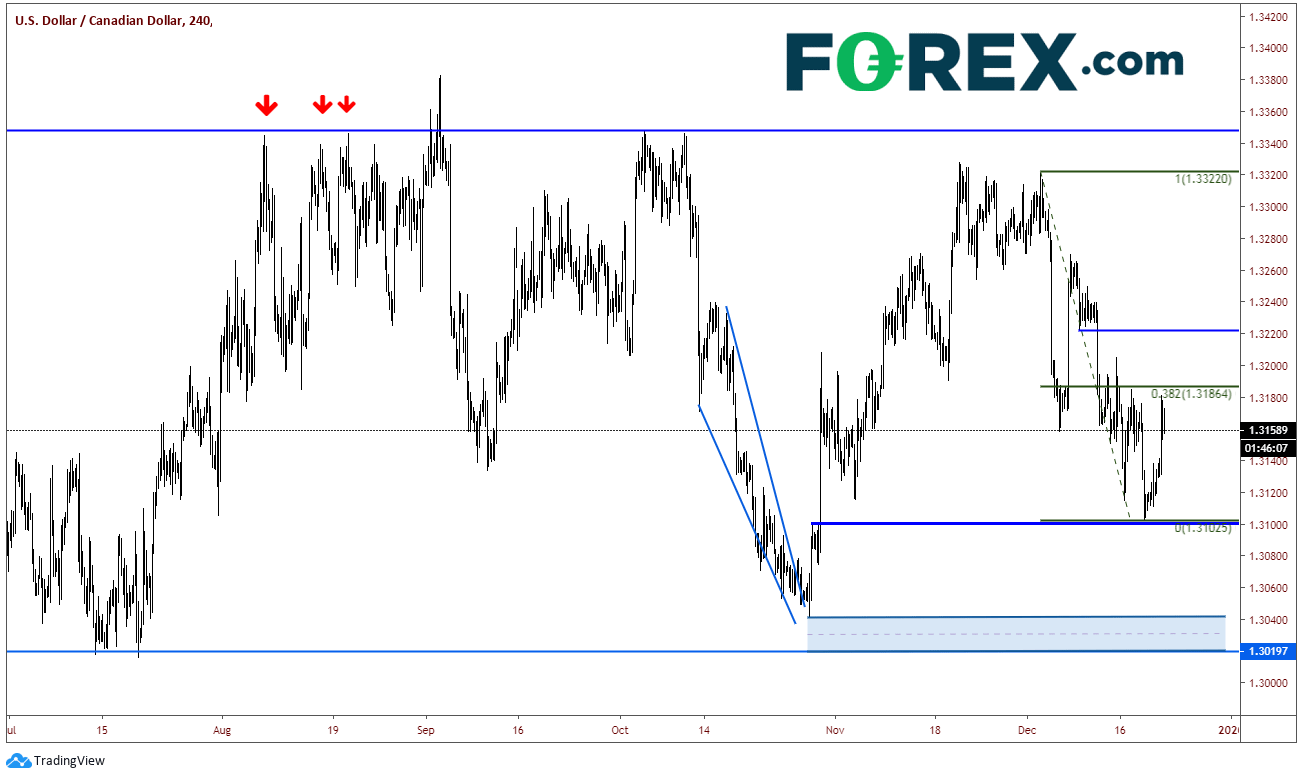
On a 240-minute timeframe, price moved higher off horizontal support near 1.3100 to the 38.2% Fibonacci retracement level from the December 3rd high to the December 18th low near 1.3185 and stalled there. Above the 38.2% retracement level is horizontal resistance near 1.3220. The next resistance level is the December 3rd high at 1.3320. Support is at the previous low near 1.3100, then a zone or zone of support between 1.3000 and 1.3140.
Source: Tradingview, City Index
Although we are focusing on the shorted time frame levels, the next longer-term move will be on a break of either 1.3000 or 1.3500. We may have to wait until the next Bank of Canada rate decision meeting on January 22, 2020 to get it though.
Canadian Retail Sales were released earlier today, and the results were disappointing. Although the data was for October, the data still matters. The headline retail sales number (MoM) was -1.2% vs expectations of +0.5% and -0.1% in September. This is the lowest headline number since November 2018. Core Retail Sales (MoM), which excludes autos, was -0.5%, vs +0.1% expected and a revised -0.1% data print from September.
The retail sales data continues a string of disappointing data from Canada. The Employment Change from November was -71,200 vs an expectation of 10,000. The Unemployment Rate also rose to 5.9% from 5.5% in October. In addition, manufacturing sales were -0.7% for October vs 0% expected. The Bank of Canada left rates unchanged at 1.75% at its December 4th meeting, however this new data will need to be considered when they meet again on January 22, 2020.
As we have written about previously, USD/CAD has been trading in a multi-year, symmetrical triangle and has been nearing the apex.
Source: Tradingview, FOREX.com
In October, price broke the rising, lower trendline of the triangle near 1.3050, only to trade back towards the 200 Day Moving Average near 1.3270, and squeeze as high as 1.3327, only to turn lower and back below the rising trendline. With today’s poor retail sales data, price has put in a long bullish white candle and price is currently trying to break back above the rising trendline at 1.3180.
Source: Tradingview, FOREX.com
On a 240-minute timeframe, price moved higher off horizontal support near 1.3100 to the 38.2% Fibonacci retracement level from the December 3rd high to the December 18th low near 1.3185 and stalled there. Above the 38.2% retracement level is horizontal resistance near 1.3220. The next resistance level is the December 3rd high at 1.3320. Support is at the previous low near 1.3100, then a zone or zone of support between 1.3000 and 1.3140.
Source: Tradingview, FOREX.com
Although we are focusing on the shorted time frame levels, the next longer-term move will be on a break of either 1.3000 or 1.3500. We may have to wait until the next Bank of Canada rate decision meeting on January 22, 2020 to get it though.
Related tags:


Open an account in minutes
Experience award-winning platforms with fast and secure execution, and enjoy tight spreads from 0.5 pts on FX and 0.3 pts on indices.
Economic calendar
Web Trader platform
Our sophisticated web-based platform is packed with features.
Related articles
AUD/USD hammered by US yields and fading RBA hike bets
US yields, dollar strength and fading RBA hike bets have combined to drive AUD/USD to fresh multi-month lows. The macro and technical bias remains bearish, although history suggests parts of the move are now reaching unusually stretched levels.

Japanese Yen Outlook: USD/JPY, GBP/JPY, AUD/JPY Setups
USD/JPY and GBP/JPY show signs of stabilising, while AUD/JPY remains vulnerable as yen crosses deliver mixed technical signals.


EUR/USD Forecast: Euro Struggles to Find Support Even After U.S. PCE Data
The euro continues to face a challenging environment in the short term. The currency has struggled to regain ground against a U.S. dollar that remains firmly supported, a dynamic reflected in EUR/USD, which has now recorded three consecutive losing sessions and a decline of roughly 0.6%.

This report is intended for general circulation only. It should not be construed as a recommendation, or an offer (or solicitation of an offer) to buy or sell any financial products. The information provided does not take into account your specific investment objectives, financial situation or particular needs. Before you act on any recommendation that may be contained in this report, independent advice ought to be sought from a financial adviser regarding the suitability of the investment product, taking into account your specific investment objectives, financial situation or particular needs.
StoneX Financial Pte. Ltd., may distribute reports produced by its respective foreign entities or affiliates within the StoneX group of companies or third parties pursuant to an arrangement under Regulation 32C of the Financial Advisers Regulations. Where the report is distributed to a person in Singapore who is not an accredited investor, expert investor or an institutional investor (as defined in the Securities Futures Act), StoneX Financial Pte. Ltd. accepts legal responsibility to such persons for the contents of the report only to the extent required by law. Singapore recipients should contact StoneX Financial Pte. Ltd. at 6826 9988 for matters arising from, or in connection with the report.
In the case of all other recipients of this report, to the extent permitted by applicable laws and regulations neither StoneX Financial Pte. Ltd. nor its associated companies will be responsible or liable for any loss or damage incurred arising out of, or in connection with, any use of the information contained in this report and all such liability is hereby expressly disclaimed. No representation or warranty is made, express or implied, that the content of this report is complete or accurate.
StoneX Financial Pte. Ltd. is not under any obligation to update this report.
Trading CFDs carries a high level of risk that may not be suitable for some investors. Consider your investment objectives, level of experience, financial resources, risk appetite and other relevant circumstances carefully. The possibility exists that you could lose some or all of your investments, including your initial deposits. If in doubt, please seek independent expert advice. Visit www.forex.com/en-sg/terms-and-policies for the complete Risk Disclosure Statement.