




Canadian Dollar Forecast: Can USD/CAD Bulls Force a Pullback?
USD/CAD sellers have been showing signs of stall after May’s hold of 1.3750 and now June’s support 100 pips lower. Can USD/CAD force a pullback before resuming the larger trend?
Share this:

Canadian Dollar Talking Points:
- The initial reaction in the US Dollar was weakness after this morning’s CPI report, and that prodded a short-term lower-low in the USD/CAD pair.
- Bigger picture, USD/CAD has continued to show reticence at or around lows, helping to build a falling wedge formation as RSI divergence has appeared on the daily chart. These are both items suggesting the possibility of pullback but that’s just a potential scenario, at this point.
- I look into USD/CAD during each price action webinar, and you’re welcome to join the next. Click here to register.
At this point it’s difficult to argue a bullish case on USD/CAD, as all that can be argued on the long side of the pair is a case of deduction. Yesterday produced a bearish engulfing candlestick and ever since the failed breakout in early-February, it’s been patterning lower-lows and lower-highs, save for a pullback in late-April and early-May that saw strident defense from sellers of the psychological 1.4000 level.
As I’ve been saying through much of this, USD/CAD remains as one of the more attractive venues for USD-weakness to play out as the longer-term range in the pair very much remains in order. That range over the past near-decade has shown a penchant for resistance around the 1.4000 and 1.4500 levels, and those are the prices that had significant impact in the pair in the first five months of this year.
USD/CAD Monthly Chart
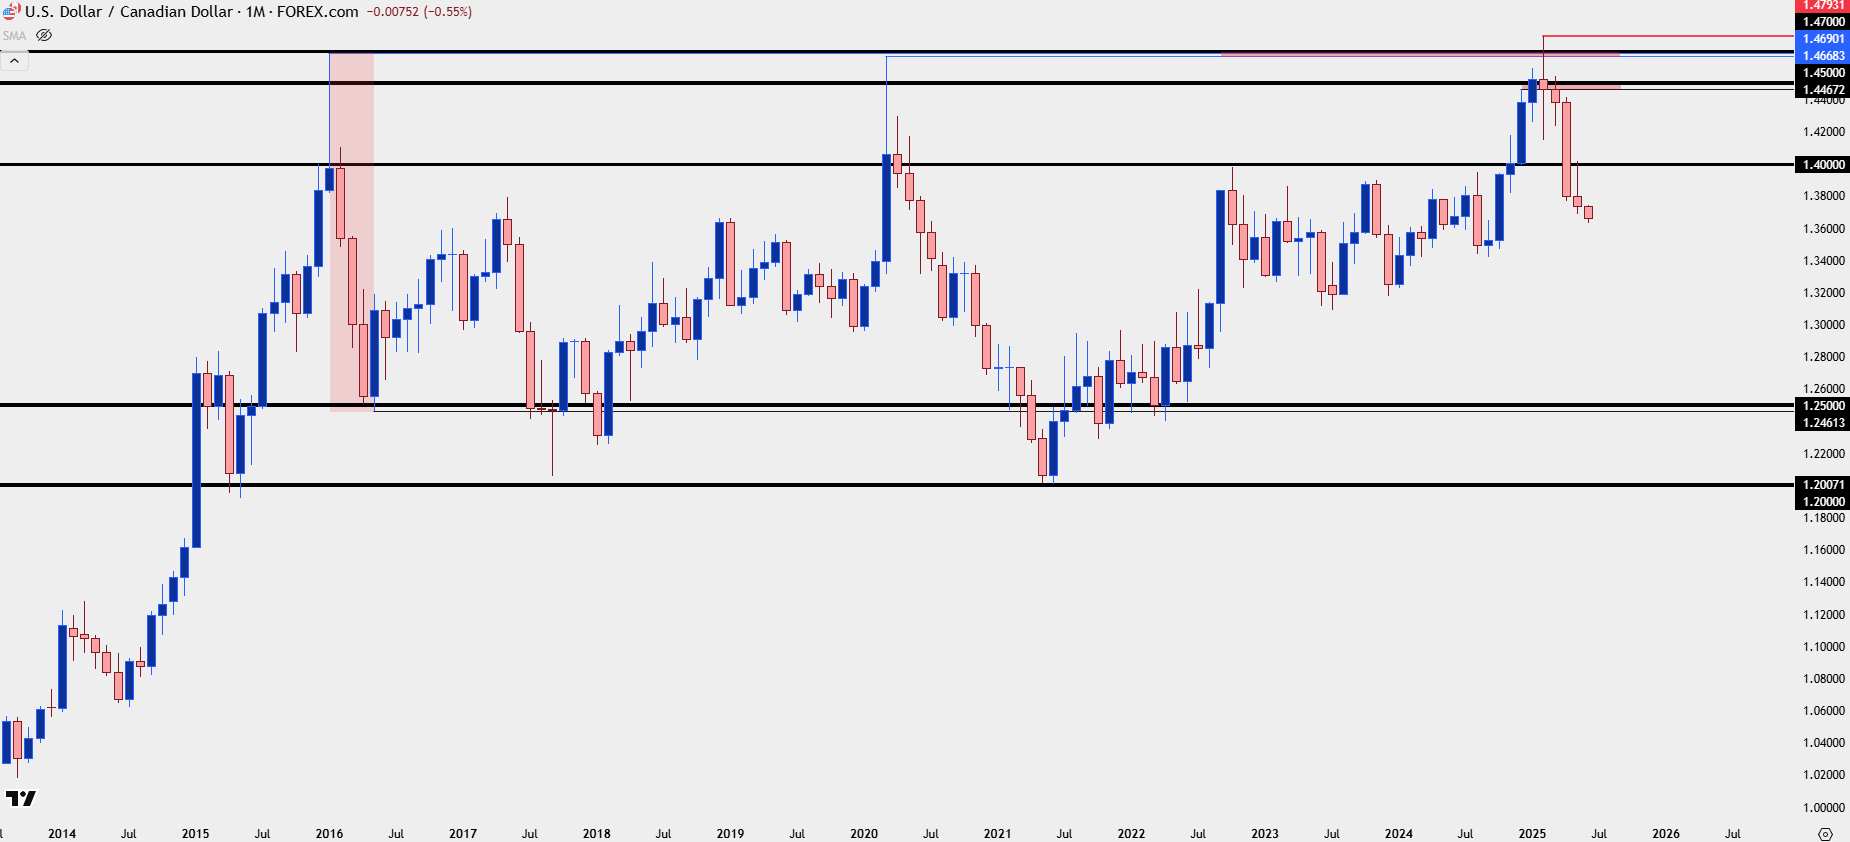
Chart prepared by James Stanley; data derived from Tradingview
The challenge at this point is how one-sided the move has become, and at the end of the day, the biggest push point for market prices is supply and demand or buying and selling rather than some overriding fundamental or technical reason for why one or the other should happen. As the old saying goes, if a market fails to move up on good news, then look out below. Well, the reason for that is that if anyone willing and able to get long already is, even the brightest news in the world fails to bring more demand. And without demand, price stalls, or starts to move lower. And then as price moves lower even with the backdrop of good news, current longs start to second guess their positions, leading to some of those longs to close positions. They close positions by selling which means more supply for little to no demand, and that drops prices even more.
Before you know it, we have a counter-trend rally taking place even as the backdrop is seemingly optimistic for bullish continuation. This is the story of positioning and it’s highly relevant in market environments.
This is also perhaps why USD bulls were thwarted back in early-February, even after the print of fresh multi-decade highs. And more recently, it’s been at least part of the reason why sellers were stalled at 1.3750 in May and then 1.3650 in June.
This doesn’t mean that prices must pullback, as I’ll look at in a moment, but it does make the prospect of chasing downside breakouts as a more dangerous proposition as the imbalance in positioning that comes along with a stalled move shows counter-trend potential.
USD/CAD Daily Chart

Chart prepared by James Stanley; data derived from Tradingview
USD/CAD Short-Term Strategy
Trading forecasts are difficult and the reason is fairly obvious, nobody has a crystal ball. About the best we can do is use the available evidence to create a hypothesis and, at least in my opinion, focus instead on risk and trade management as more controllable variables in an otherwise unpredictable world. This is what I teach in the Trader’s Course and it remains relevant across possible setups and strategies.
For USD/CAD, given the diverging RSI on the daily and the falling wedge formation, this presents pullback potential, similar to what I had talked about last Friday. That led into a pullback to start this week, with price finding resistance at a confluence of trendlines yesterday morning and that led to the build of a bearish engulfing candlestick on the above daily chart.
So I would still qualify this as bearish, but I would hesitate to chase price this close to recent lows and this far away from the prior swing-high. Instead, I want to look for lower-high resistance and there’s a couple of spots of interest for such. Short-term, there’s the 1.3700 zone that was in-play last week. I’m considering this as an ‘r1’ zone of resistance. Above that, the swing-high from earlier in the week presents an ‘r2’ zone of resistance from 1.3728-1.3731, and above that, we have the 1.3750 zone that was resistance and a lower-high last week, after showing as support in early-May.
If bulls can pose a bounce above all three of those areas, then we would have a bullish break of the falling wedge formation and the door would open for a larger pullback. In that scenario, I would anticipate more attractive bullish USD backdrops elsewhere, such as EUR/USD, but there’s a few steps to fill in before that outcome can be entertained.
USD/CAD Four-Hour Chart
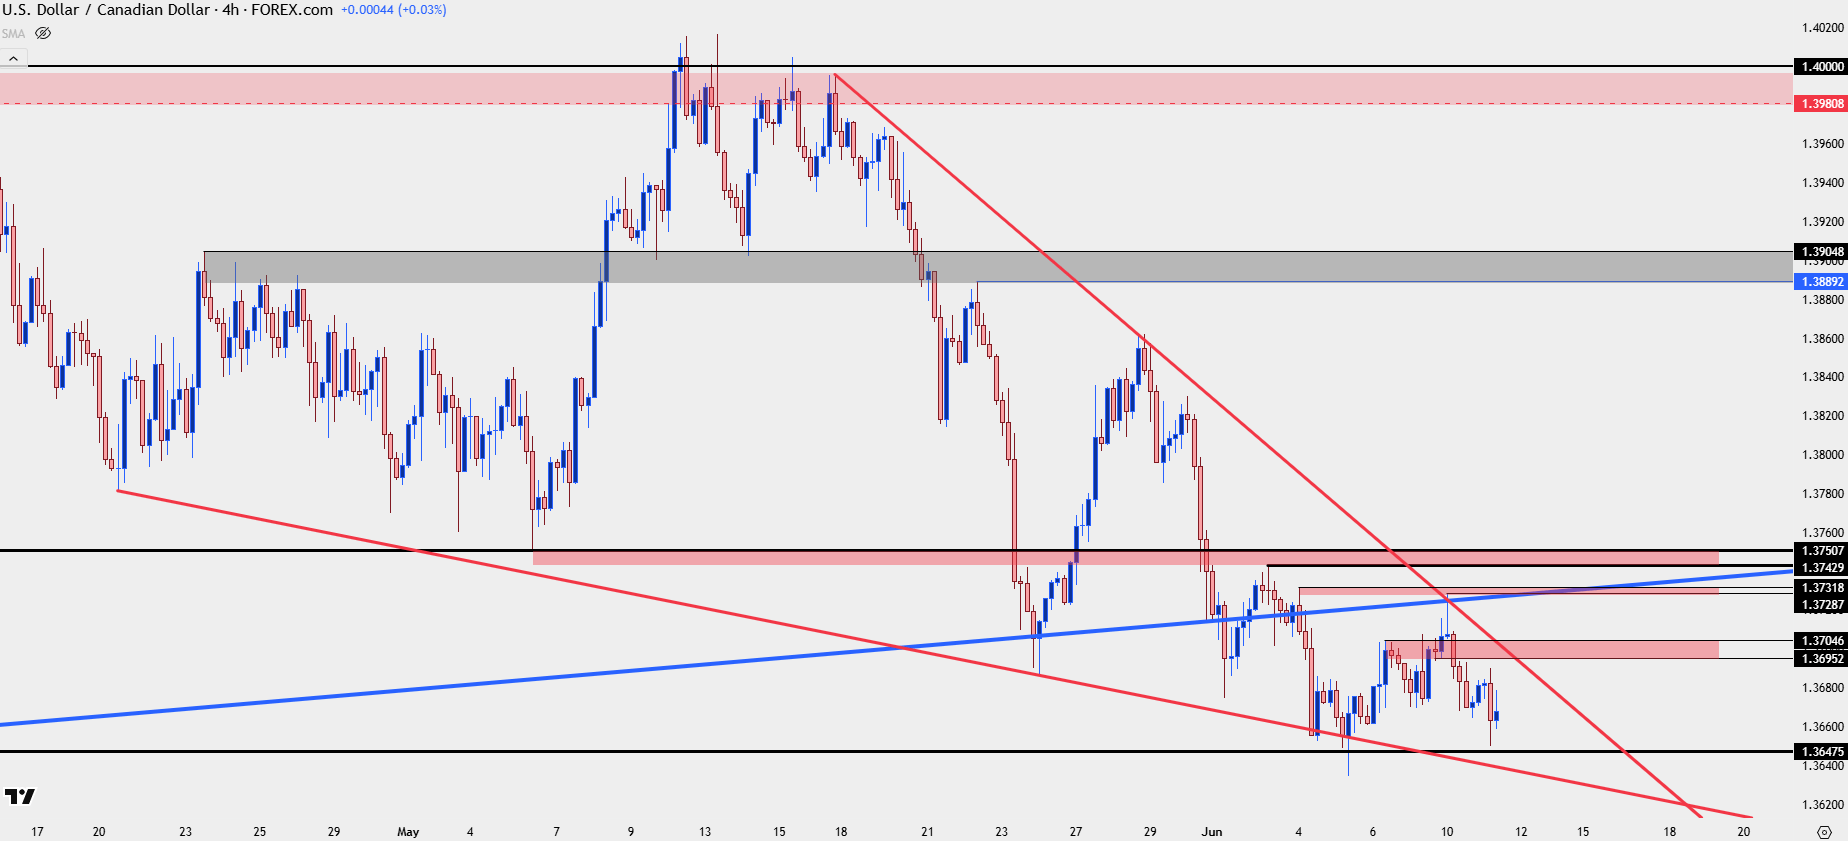 Chart prepared by James Stanley; data derived from Tradingview
--- written by James Stanley, Senior Strategist
Canadian Dollar Talking Points:
- The initial reaction in the US Dollar was weakness after this morning’s CPI report, and that prodded a short-term lower-low in the USD/CAD pair.
- Bigger picture, USD/CAD has continued to show reticence at or around lows, helping to build a falling wedge formation as RSI divergence has appeared on the daily chart. These are both items suggesting the possibility of pullback but that’s just a potential scenario, at this point.
- I look into USD/CAD during each price action webinar, and you’re welcome to join the next. Click here to register.
At this point it’s difficult to argue a bullish case on USD/CAD, as all that can be argued on the long side of the pair is a case of deduction. Yesterday produced a bearish engulfing candlestick and ever since the failed breakout in early-February, it’s been patterning lower-lows and lower-highs, save for a pullback in late-April and early-May that saw strident defense from sellers of the psychological 1.4000 level.
As I’ve been saying through much of this, USD/CAD remains as one of the more attractive venues for USD-weakness to play out as the longer-term range in the pair very much remains in order. That range over the past near-decade has shown a penchant for resistance around the 1.4000 and 1.4500 levels, and those are the prices that had significant impact in the pair in the first five months of this year.
USD/CAD Monthly Chart
Chart prepared by James Stanley; data derived from Tradingview
The challenge at this point is how one-sided the move has become, and at the end of the day, the biggest push point for market prices is supply and demand or buying and selling rather than some overriding fundamental or technical reason for why one or the other should happen. As the old saying goes, if a market fails to move up on good news, then look out below. Well, the reason for that is that if anyone willing and able to get long already is, even the brightest news in the world fails to bring more demand. And without demand, price stalls, or starts to move lower. And then as price moves lower even with the backdrop of good news, current longs start to second guess their positions, leading to some of those longs to close positions. They close positions by selling which means more supply for little to no demand, and that drops prices even more.
Before you know it, we have a counter-trend rally taking place even as the backdrop is seemingly optimistic for bullish continuation. This is the story of positioning and it’s highly relevant in market environments.
This is also perhaps why USD bulls were thwarted back in early-February, even after the print of fresh multi-decade highs. And more recently, it’s been at least part of the reason why sellers were stalled at 1.3750 in May and then 1.3650 in June.
This doesn’t mean that prices must pullback, as I’ll look at in a moment, but it does make the prospect of chasing downside breakouts as a more dangerous proposition as the imbalance in positioning that comes along with a stalled move shows counter-trend potential.
USD/CAD Daily Chart
Chart prepared by James Stanley; data derived from Tradingview
USD/CAD Short-Term Strategy
Trading forecasts are difficult and the reason is fairly obvious, nobody has a crystal ball. About the best we can do is use the available evidence to create a hypothesis and, at least in my opinion, focus instead on risk and trade management as more controllable variables in an otherwise unpredictable world. This is what I teach in the Trader’s Course and it remains relevant across possible setups and strategies.
For USD/CAD, given the diverging RSI on the daily and the falling wedge formation, this presents pullback potential, similar to what I had talked about last Friday. That led into a pullback to start this week, with price finding resistance at a confluence of trendlines yesterday morning and that led to the build of a bearish engulfing candlestick on the above daily chart.
So I would still qualify this as bearish, but I would hesitate to chase price this close to recent lows and this far away from the prior swing-high. Instead, I want to look for lower-high resistance and there’s a couple of spots of interest for such. Short-term, there’s the 1.3700 zone that was in-play last week. I’m considering this as an ‘r1’ zone of resistance. Above that, the swing-high from earlier in the week presents an ‘r2’ zone of resistance from 1.3728-1.3731, and above that, we have the 1.3750 zone that was resistance and a lower-high last week, after showing as support in early-May.
If bulls can pose a bounce above all three of those areas, then we would have a bullish break of the falling wedge formation and the door would open for a larger pullback. In that scenario, I would anticipate more attractive bullish USD backdrops elsewhere, such as EUR/USD, but there’s a few steps to fill in before that outcome can be entertained.
USD/CAD Four-Hour Chart
Chart prepared by James Stanley; data derived from Tradingview
--- written by James Stanley, Senior Strategist
Related tags:
Latest market news




Open an account in minutes
Experience award-winning platforms with fast and secure execution, and enjoy tight spreads from 0.5 pts on FX and 0.3 pts on indices.
Economic calendar
Web Trader platform
Our sophisticated web-based platform is packed with features.
Related articles
USD/CAD and USD/MXN Q4 2026 Outlook: Will the U.S. Dollar Dominate North America Again?
The final stretch of 2026 is approaching, and North America's major currencies have begun to show a shift in the strength dynamics seen earlier in the year. New expectations of a more aggressive monetary policy stance, particularly in the United States, could be significantly reshaping the outlook for the region. At the same time, this backdrop, combined with potential trade tensions across North America, may become one of the most important drivers of currency performance in the months ahead.


Oil Quietly Hands the Fed a Reason to Stay Hawkish
Oil prices and the U.S. dollar are both on the front foot as elevated energy costs feed Fed warnings that inflation may prove sticky.


S&P 500 forecast: Stocks extend drop as correction risks grow
US and global equity markets have extended Wednesday’s sell-off, with Wall Street opening lower after a weak handover from Asia and Europe. The deterioration in risk appetite has been spreading across global markets. The dollar was firmer, Treasury yields were holding onto yesterday’s gains, while gold, silver and bitcoin were all under pressure alongside equities and major currencies.
This report is intended for general circulation only. It should not be construed as a recommendation, or an offer (or solicitation of an offer) to buy or sell any financial products. The information provided does not take into account your specific investment objectives, financial situation or particular needs. Before you act on any recommendation that may be contained in this report, independent advice ought to be sought from a financial adviser regarding the suitability of the investment product, taking into account your specific investment objectives, financial situation or particular needs.
StoneX Financial Pte. Ltd., may distribute reports produced by its respective foreign entities or affiliates within the StoneX group of companies or third parties pursuant to an arrangement under Regulation 32C of the Financial Advisers Regulations. Where the report is distributed to a person in Singapore who is not an accredited investor, expert investor or an institutional investor (as defined in the Securities Futures Act), StoneX Financial Pte. Ltd. accepts legal responsibility to such persons for the contents of the report only to the extent required by law. Singapore recipients should contact StoneX Financial Pte. Ltd. at 6826 9988 for matters arising from, or in connection with the report.
In the case of all other recipients of this report, to the extent permitted by applicable laws and regulations neither StoneX Financial Pte. Ltd. nor its associated companies will be responsible or liable for any loss or damage incurred arising out of, or in connection with, any use of the information contained in this report and all such liability is hereby expressly disclaimed. No representation or warranty is made, express or implied, that the content of this report is complete or accurate.
StoneX Financial Pte. Ltd. is not under any obligation to update this report.
Trading CFDs carries a high level of risk that may not be suitable for some investors. Consider your investment objectives, level of experience, financial resources, risk appetite and other relevant circumstances carefully. The possibility exists that you could lose some or all of your investments, including your initial deposits. If in doubt, please seek independent expert advice. Visit www.forex.com/en-sg/terms-and-policies for the complete Risk Disclosure Statement.