





Canadian Dollar Forecast: USD/CAD Breakdown Stall into Elections
USD/CAD bears have come on quickly but for the past three weeks have largely stalled at support of 1.3846.
Share this:

Canadian Dollar, USD/CAD Talking Points:
- April has been a very bearish month for USD/CAD but the bulk of those losses were within the first 11 days. Since then, USD/CAD has held support at the 1.3846 level which remains in-play into the weekend.
- Monday brings Canadian elections, and Mark Carney is currently favored to win. Canada has six time zones and polls close at 9:30 PM, after which votes are tallied. Preliminary results may be available shortly after polls close and official results confirmed within a few days after.
- I’ll be looking into USD/CAD price action in the Tuesday webinar and you’re welcome to join: Click here for registration information.
The short-side trend has come on quickly in USD/CAD, and from a longer-term perspective this continues the range-bound backdrop that’s been in the pair for the past nine-plus years. But much like the US Dollar, the bulk of those losses were relegated to the first eleven days of the month, with USD/CAD spinning its wheels for much of the time since and with the 1.3846 level continuing to hold the lows. I had looked at that level on the 11th as that price was a swing high from a year ago; and for the past three weeks this has been support.
USD/CAD Weekly Chart
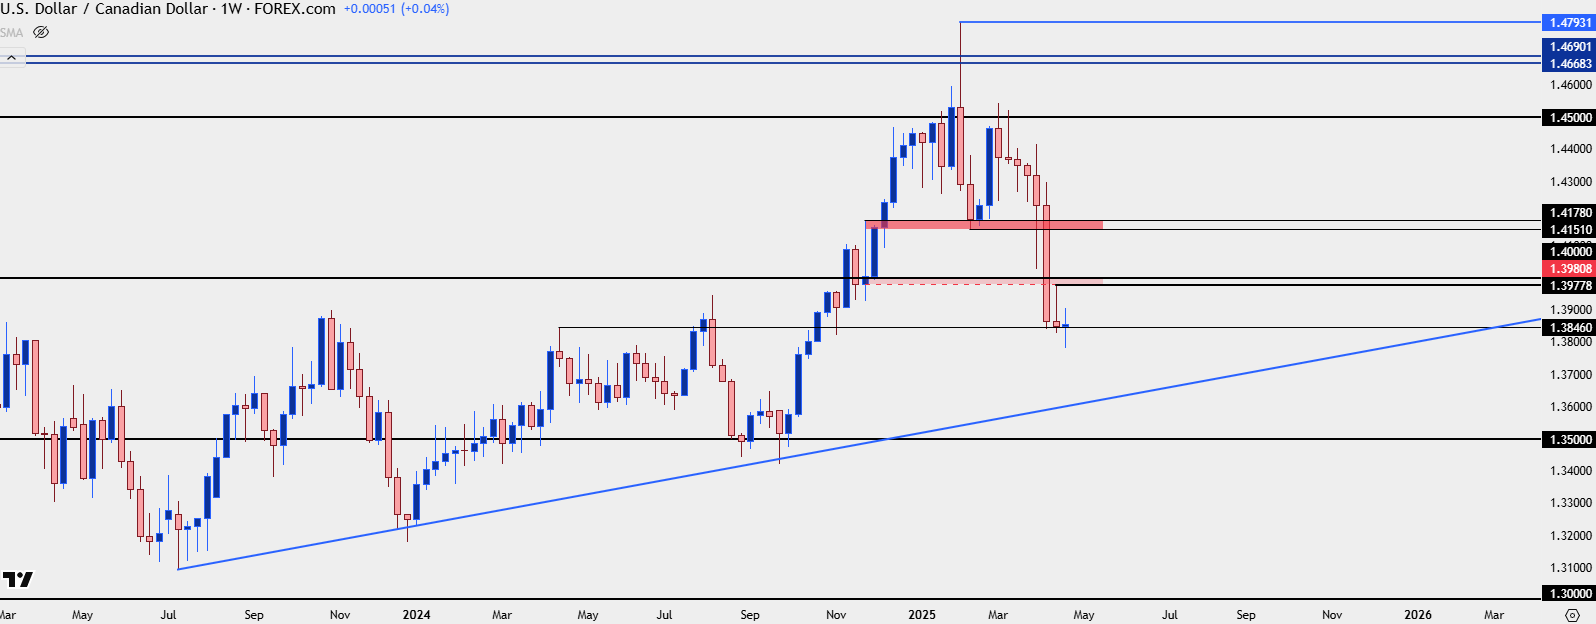 Chart prepared by James Stanley; data derived from Tradingview
USD/CAD Shorter-Term Strategy
When that 1.3846 level came into play earlier in the month, RSI on the daily was nearing oversold territory and given how aggressively bears had pushed the pair through the 1.4000 psychological level, it made for a difficult trend to chase. I talked about that in the article published at the time, instead focusing on resistance around the 1.4000 handle. And as I said then, ideally, sellers wouldn’t even allow for a 1.4000 test as bearish anticipation would hold resistance below the psychological level. So, I spanned that price down to a prior swing of 1.3980 to look for a resistance zone. Even that couldn’t come into play, however, as the swing high from that bounce was 2.2 pips shy of 1.3980, with sellers taking another swing shortly after.
But since then, bears haven’t been able to break much fresh ground as they’ve continually been caught at the 1.3846 level and that’s allowed for a couple of reversal items to show on the chart. First is a diverging RSI element with higher-lows on RSI to go along with lower-lows on price; and from a price action perspective a weak falling wedge has formed.
These items don’t necessarily mean that a low is in-place, and that price will reverse for a long time. But it does highlight that chasing the move lower from here could prove challenging and, instead, pullbacks with tests of resistance could be a more attractive way of trying to work with the move.
For that, I’m sticking to the same 1.4000 test and this time, I’d be willing to accept a test through the big figure. The more important matter would be a daily close as I’d want to see sellers respond to that test in a noticeable fashion to illustrate that they might be ready to run the trend lower again. If they can’t – then the next zone of resistance comes into play at 1.4151-1.4178. This was a big zone of resistance turned support when the pair was ranging, so another test there with a show of a swing high could make the prospect of bearish continuation attractive again.
USD/CAD Daily Price Chart
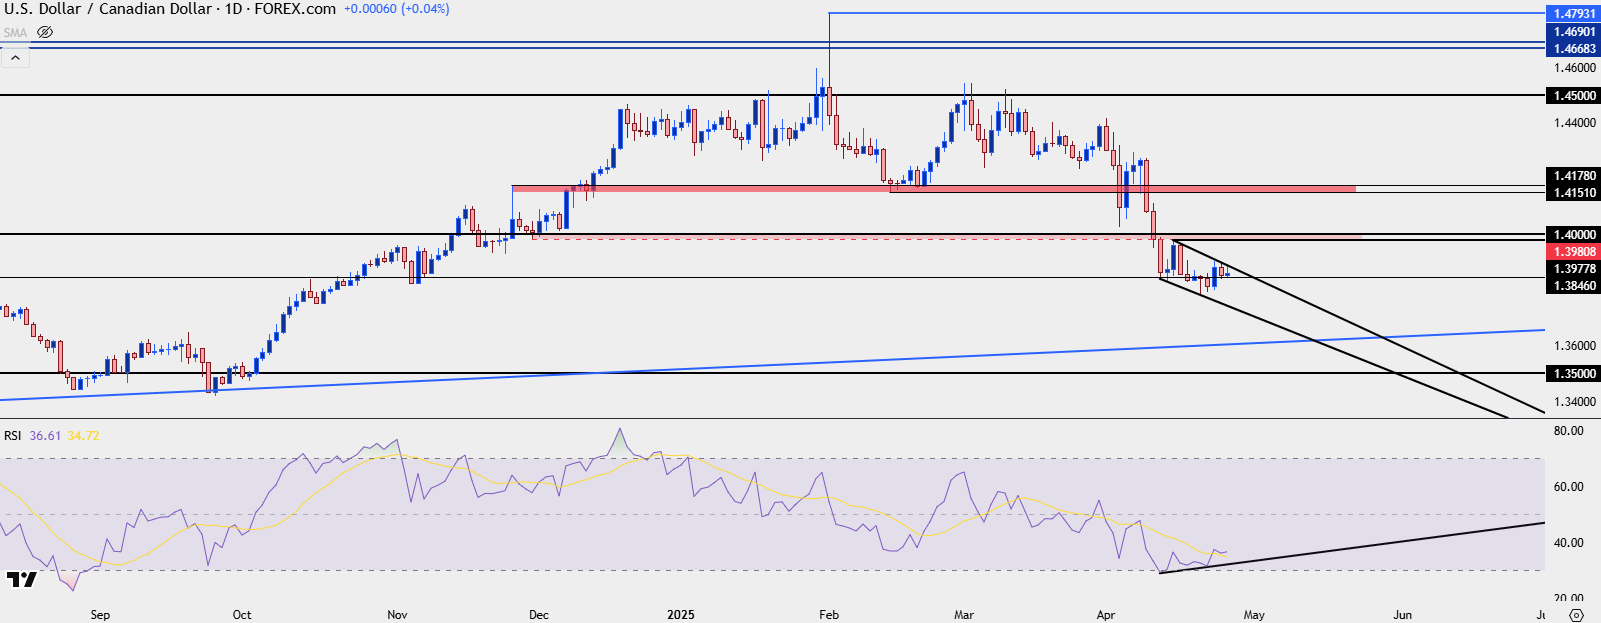 Chart prepared by James Stanley; data derived from Tradingview
--- written by James Stanley, Senior Strategist
Canadian Dollar, USD/CAD Talking Points:
- April has been a very bearish month for USD/CAD but the bulk of those losses were within the first 11 days. Since then, USD/CAD has held support at the 1.3846 level which remains in-play into the weekend.
- Monday brings Canadian elections, and Mark Carney is currently favored to win. Canada has six time zones and polls close at 9:30 PM, after which votes are tallied. Preliminary results may be available shortly after polls close and official results confirmed within a few days after.
- I’ll be looking into USD/CAD price action in the Tuesday webinar and you’re welcome to join: Click here for registration information.
The short-side trend has come on quickly in USD/CAD, and from a longer-term perspective this continues the range-bound backdrop that’s been in the pair for the past nine-plus years. But much like the US Dollar, the bulk of those losses were relegated to the first eleven days of the month, with USD/CAD spinning its wheels for much of the time since and with the 1.3846 level continuing to hold the lows. I had looked at that level on the 11th as that price was a swing high from a year ago; and for the past three weeks this has been support.
USD/CAD Weekly Chart
USD/CAD Shorter-Term Strategy
When that 1.3846 level came into play earlier in the month, RSI on the daily was nearing oversold territory and given how aggressively bears had pushed the pair through the 1.4000 psychological level, it made for a difficult trend to chase. I talked about that in the article published at the time, instead focusing on resistance around the 1.4000 handle. And as I said then, ideally, sellers wouldn’t even allow for a 1.4000 test as bearish anticipation would hold resistance below the psychological level. So, I spanned that price down to a prior swing of 1.3980 to look for a resistance zone. Even that couldn’t come into play, however, as the swing high from that bounce was 2.2 pips shy of 1.3980, with sellers taking another swing shortly after.
But since then, bears haven’t been able to break much fresh ground as they’ve continually been caught at the 1.3846 level and that’s allowed for a couple of reversal items to show on the chart. First is a diverging RSI element with higher-lows on RSI to go along with lower-lows on price; and from a price action perspective a weak falling wedge has formed.
These items don’t necessarily mean that a low is in-place, and that price will reverse for a long time. But it does highlight that chasing the move lower from here could prove challenging and, instead, pullbacks with tests of resistance could be a more attractive way of trying to work with the move.
For that, I’m sticking to the same 1.4000 test and this time, I’d be willing to accept a test through the big figure. The more important matter would be a daily close as I’d want to see sellers respond to that test in a noticeable fashion to illustrate that they might be ready to run the trend lower again. If they can’t – then the next zone of resistance comes into play at 1.4151-1.4178. This was a big zone of resistance turned support when the pair was ranging, so another test there with a show of a swing high could make the prospect of bearish continuation attractive again.
USD/CAD Daily Price Chart
--- written by James Stanley, Senior Strategist
Related tags:
Latest market news



Open an account in minutes
Experience award-winning platforms with fast and secure execution, and enjoy tight spreads from 0.5 pts on FX and 0.3 pts on indices.
Economic calendar
Web Trader platform
Our sophisticated web-based platform is packed with features.
Related articles

USD/JPY Bulls Continue to Push as Markets ‘Bet Against the House’
USD/JPY is now up by more than 500 pips from the low taken the day that Scott Bessent taunted markets, saying ‘you can bet against me if you want.’

US Dollar Price Action Setups: USD/JPY, USD/CAD, EUR/USD, GBP/USD, Gold
The US Dollar has rallied since last week’s rate hike and USD/JPY remains a massive driver across the USD complex.

USD/CAD Analysis: Is the Canadian Dollar Running Out of Support?
A new trading week is underway, and the Canadian dollar continues to show signs of weakening momentum. This can be seen in recent USD/CAD price action, with the pair gaining nearly 0.7% over the last four trading sessions.

This report is intended for general circulation only. It should not be construed as a recommendation, or an offer (or solicitation of an offer) to buy or sell any financial products. The information provided does not take into account your specific investment objectives, financial situation or particular needs. Before you act on any recommendation that may be contained in this report, independent advice ought to be sought from a financial adviser regarding the suitability of the investment product, taking into account your specific investment objectives, financial situation or particular needs.
StoneX Financial Pte. Ltd., may distribute reports produced by its respective foreign entities or affiliates within the StoneX group of companies or third parties pursuant to an arrangement under Regulation 32C of the Financial Advisers Regulations. Where the report is distributed to a person in Singapore who is not an accredited investor, expert investor or an institutional investor (as defined in the Securities Futures Act), StoneX Financial Pte. Ltd. accepts legal responsibility to such persons for the contents of the report only to the extent required by law. Singapore recipients should contact StoneX Financial Pte. Ltd. at 6826 9988 for matters arising from, or in connection with the report.
In the case of all other recipients of this report, to the extent permitted by applicable laws and regulations neither StoneX Financial Pte. Ltd. nor its associated companies will be responsible or liable for any loss or damage incurred arising out of, or in connection with, any use of the information contained in this report and all such liability is hereby expressly disclaimed. No representation or warranty is made, express or implied, that the content of this report is complete or accurate.
StoneX Financial Pte. Ltd. is not under any obligation to update this report.
Trading CFDs carries a high level of risk that may not be suitable for some investors. Consider your investment objectives, level of experience, financial resources, risk appetite and other relevant circumstances carefully. The possibility exists that you could lose some or all of your investments, including your initial deposits. If in doubt, please seek independent expert advice. Visit www.forex.com/en-sg/terms-and-policies for the complete Risk Disclosure Statement.