



USD/CAD Analysis: Is the Canadian Dollar Running Out of Support?
A new trading week is underway, and the Canadian dollar continues to show signs of weakening momentum. This can be seen in recent USD/CAD price action, with the pair gaining nearly 0.7% over the last four trading sessions.
Share this:

A new trading week is underway, and the Canadian dollar continues to show signs of weakening momentum. This can be seen in recent USD/CAD price action, with the pair gaining nearly 0.7% over the last four trading sessions. Buying pressure around the pair has been supported primarily by two factors: expectations of a more aggressive Federal Reserve and an ongoing trade dispute that still shows few signs of resolution. Both developments appear to be weighing on the Canadian dollar's relative attractiveness and, as long as these conditions remain in place, buying pressure around USD/CAD could continue to play a relevant role in the sessions ahead.

Is the USD Becoming a Threat?
Since last week, expectations of a more aggressive Federal Reserve have continued to gain traction. This perception is largely driven by persistent inflationary pressures in the United States, a backdrop that could justify additional rate increases over the coming months. In fact, CME Group's probability tracker still assigns more than a 50% chance that interest rates will rise another 0.25% to the 4.25% area at the October 28 meeting.
The situation looks somewhat different at the Bank of Canada. Although policymakers continue to acknowledge inflation risks, there have not yet been equally strong signals pointing toward a more aggressive policy stance. Market expectations for the October 28 meeting remain broadly split between another rate hike and an unchanged decision, highlighting a greater degree of uncertainty surrounding the bank's next move. As a result, the Federal Reserve continues to stand out as the institution with the greatest potential to maintain a restrictive monetary policy over the coming months.
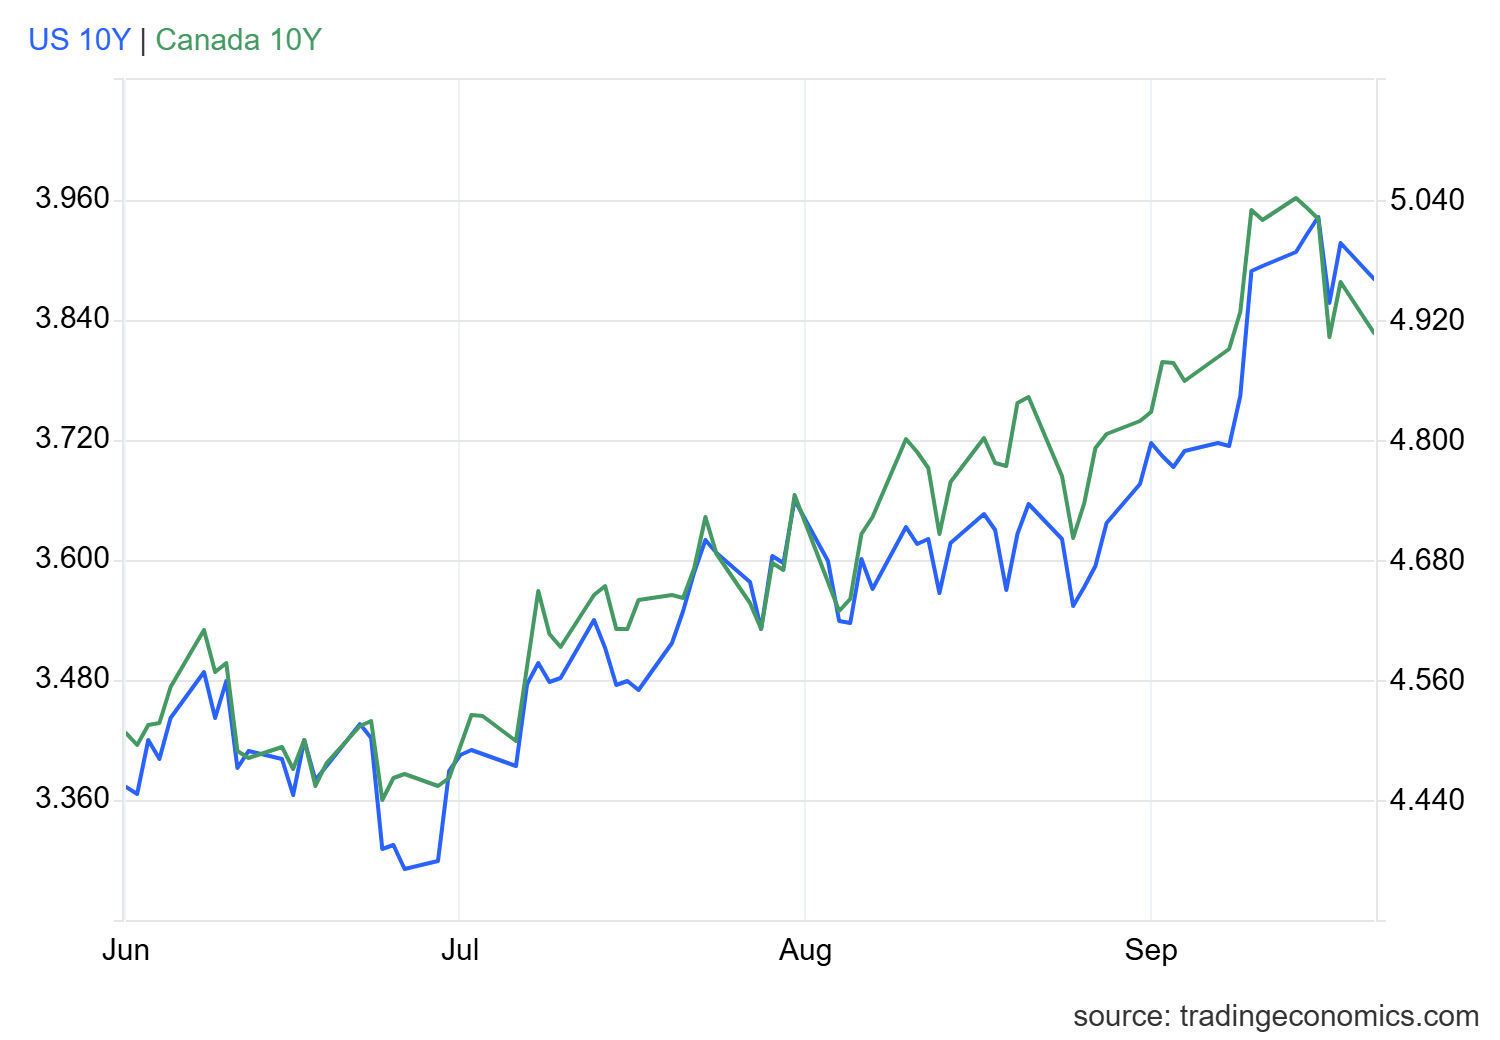
This divergence also has important implications for bond markets. Although 10-year bond yields in both countries have moved higher recently, the yield differential continues to favor the United States. While U.S. Treasury yields remain around the 5.00% area, Canadian bond yields continue to trade below 4.00%. This gap remains important because it supports the relative attractiveness of U.S. assets and could widen further if the Federal Reserve maintains a more aggressive stance than the Bank of Canada.
Source: TradingEconomics
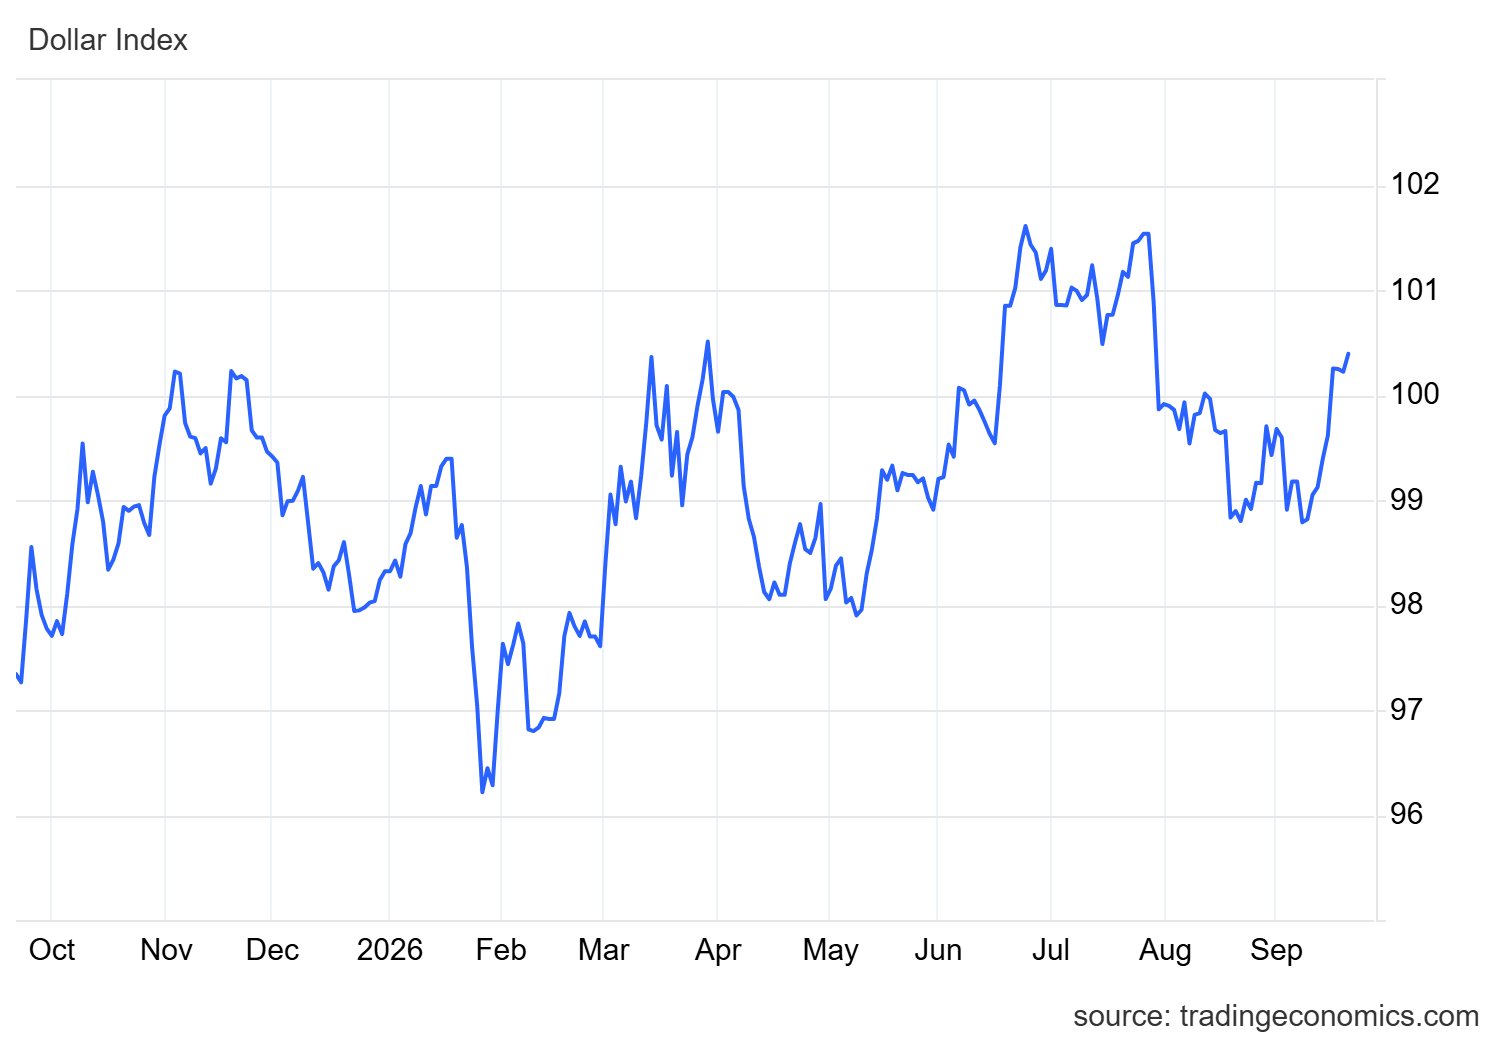
This advantage is already beginning to show up in the performance of the U.S. dollar. Recent movements in the DXY, the index that measures the dollar against its main rivals, continue to reflect strength above the 100-point level. This suggests that demand for the U.S. dollar remains well supported, backed both by the appeal of the bond market and expectations of a more restrictive monetary policy. As a consequence, the Canadian dollar continues to struggle to regain lost ground consistently.
Source: TradingEconomics
Taking all of this into account, the difference in outlook between the two central banks continues to favor the U.S. dollar. As long as markets continue to price in a more aggressive Federal Reserve than the Bank of Canada, capital flows may continue to favor USD-denominated assets and limit a stronger recovery in the Canadian dollar. Under this scenario, buying pressure around USD/CAD could remain relevant during the coming sessions.
Is There Still No Progress in the Trade Dispute?
Since September 15, when revised 50% tariffs on selected Canadian products came into effect, there have been no significant developments pointing toward a quick resolution of the trade conflict. In addition, beginning on September 29, the United States may start applying import restrictions on products from sectors such as automobiles and dairy. On the Canadian side, the countermeasures announced on September 8 remain in place, including tariffs ranging from 15% to 50% on U.S. goods. So far, both countries have maintained firm positions, and negotiations have failed to alter the overall direction of the dispute.
This situation remains highly relevant for the Canadian dollar because the currency has repeatedly shown weakness whenever trade tensions escalate. Moreover, the conflict directly affects an economy where more than 70% of exports are destined for the United States, creating uncertainty around future growth prospects. Until more meaningful diplomatic progress emerges, caution is likely to remain a dominant theme around the CAD and could continue supporting buying pressure in USD/CAD over the coming weeks.
USD/CAD Technical Forecast
Source: StoneX, Tradingview
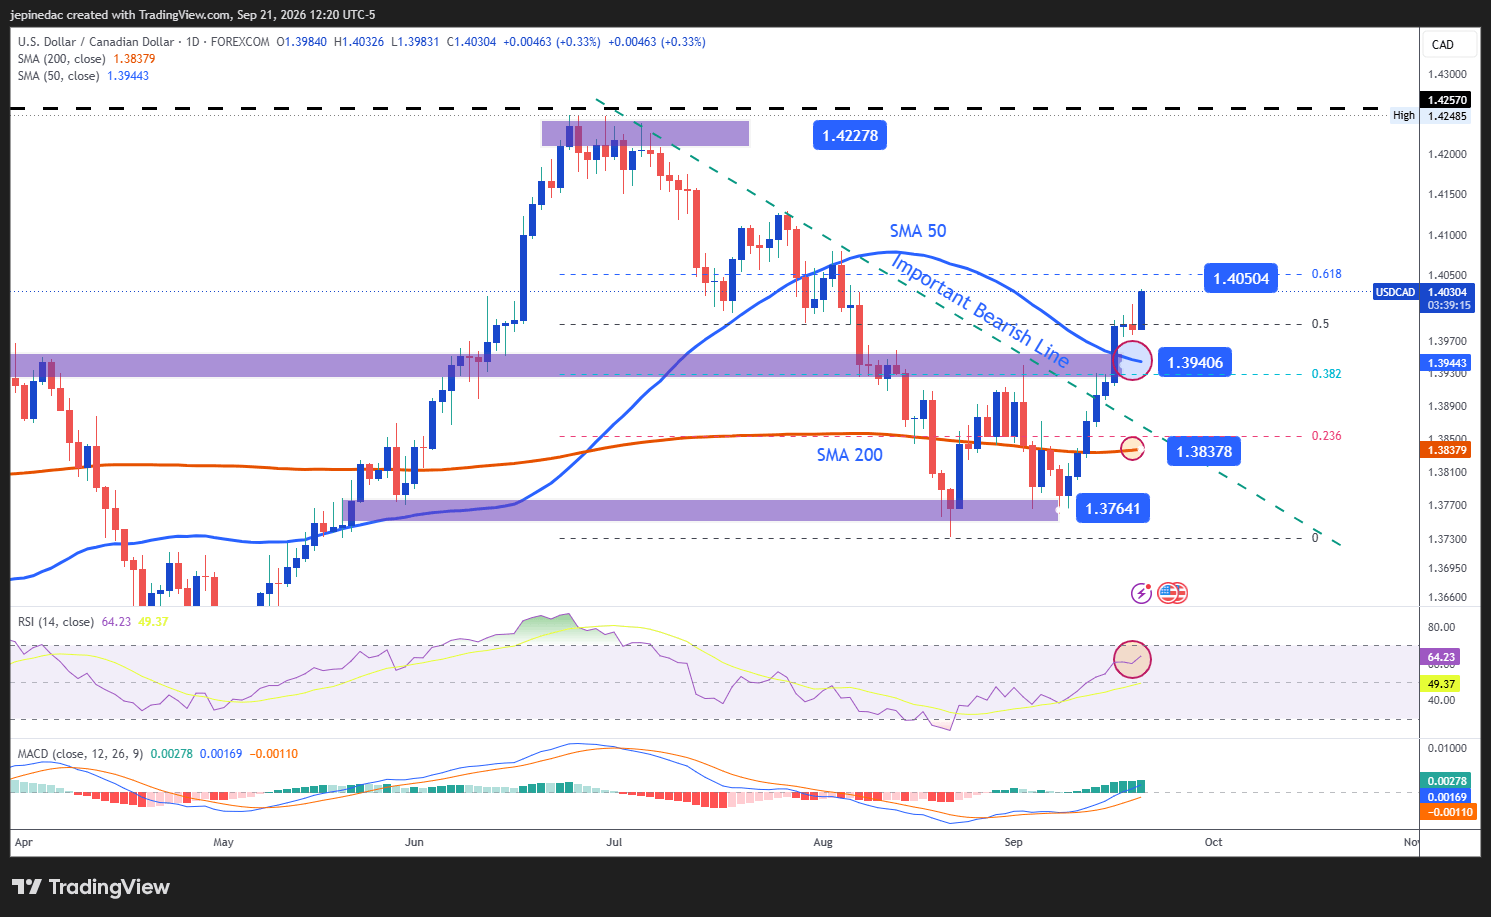
- Bullish momentum starts to emerge: Over recent months, USD/CAD had been developing a medium-term downtrend that became one of the chart's most important technical structures. However, the recent recovery has already generated a meaningful break above this trendline. If buying pressure remains in place over the coming sessions, a more established bullish structure could begin to emerge in the short term.
- RSI: The RSI remains above the 50 neutral level, a reading that reflects growing bullish momentum within the chart. As long as this dynamic remains intact, the bullish bias may continue strengthening over the coming sessions.
- MACD: A similar picture can be observed in the MACD, whose histogram continues to trade above the 0 neutral line. This reading suggests that short-term moving averages continue to favor bullish price action and supports the possibility that the current upward bias remains relevant.
Key Levels:
- 1.40504 – Key Resistance: The last major upside barrier on the chart, coinciding with the most relevant 61.8% Fibonacci retracement level. Price action that manages to consolidate above this area could signal stronger bullish control and open the door to a more developed upward structure in the weeks ahead.
- 1.39406 – Near-Term Barrier: A level that coincides with the 50-period moving average and the 38.2% Fibonacci retracement zone. It remains the most important reference to monitor in the event of short-term bearish corrections.
- 1.38378 – Critical Support: This level represents the most important downside barrier on the chart as it coincides with the 200-period moving average. A move back toward this area could undermine the credibility of the recent recovery, revive concerns about a lack of direction, and favor the development of a broader consolidation range.
Written by Julian Pineda, CFA, CMT – Market Analyst
Follow him on: @julianpineda25
Latest market news




Open an account in minutes
Experience award-winning platforms with fast and secure execution, and enjoy tight spreads from 0.5 pts on FX and 0.3 pts on indices.
Economic calendar
Web Trader platform
Our sophisticated web-based platform is packed with features.
Related articles
USD/JPY forecast: Dollar remains fundamentally supported ahead of CPI
The USD/JPY eased lower today with the greenback also declining against several other currencies. However, at the time of writing, oil prices were bouncing back and yields were off their lows again. The US dollar hadn’t moved much yet, but these forces could help it to regain its poise ahead of the release of US CPI on Wednesday.
British Pound Technical Outlook: GBP/USD Bulls Fight to Stabilize at Critical Support 10 13 2026
GBP/USD is compressing into a tight near-term range just above key support, with a breakout likely to provide the next directional cue.

EUR/USD forecast: Downside risks persist despite recovery
Amid a lack of any major news, the FX markets have been largely in consolidation mode in the first half of Tuesday’s session. The US dollar eased along with bond yields and oil prices, allowing downbeat currencies like the euro to rebound modestly. With US CPI data due for release on Wednesday, don’t expect much in the way of a sharper decline in USD ahead of it. If anything, we could see the dollar buying resume, especially if crude oil prices catch a bid again amid the ongoing situation.
This report is intended for general circulation only. It should not be construed as a recommendation, or an offer (or solicitation of an offer) to buy or sell any financial products. The information provided does not take into account your specific investment objectives, financial situation or particular needs. Before you act on any recommendation that may be contained in this report, independent advice ought to be sought from a financial adviser regarding the suitability of the investment product, taking into account your specific investment objectives, financial situation or particular needs.
StoneX Financial Pte. Ltd., may distribute reports produced by its respective foreign entities or affiliates within the StoneX group of companies or third parties pursuant to an arrangement under Regulation 32C of the Financial Advisers Regulations. Where the report is distributed to a person in Singapore who is not an accredited investor, expert investor or an institutional investor (as defined in the Securities Futures Act), StoneX Financial Pte. Ltd. accepts legal responsibility to such persons for the contents of the report only to the extent required by law. Singapore recipients should contact StoneX Financial Pte. Ltd. at 6826 9988 for matters arising from, or in connection with the report.
In the case of all other recipients of this report, to the extent permitted by applicable laws and regulations neither StoneX Financial Pte. Ltd. nor its associated companies will be responsible or liable for any loss or damage incurred arising out of, or in connection with, any use of the information contained in this report and all such liability is hereby expressly disclaimed. No representation or warranty is made, express or implied, that the content of this report is complete or accurate.
StoneX Financial Pte. Ltd. is not under any obligation to update this report.
Trading CFDs carries a high level of risk that may not be suitable for some investors. Consider your investment objectives, level of experience, financial resources, risk appetite and other relevant circumstances carefully. The possibility exists that you could lose some or all of your investments, including your initial deposits. If in doubt, please seek independent expert advice. Visit www.forex.com/en-sg/terms-and-policies for the complete Risk Disclosure Statement.