



CHF/JPY waterfall meets a history of counter-trend squeezes
The yen has had hawkish BOJ repricing, record intervention and unusually strong US support working in its favour, but CHF/JPY is now so stretched that the risk of a counter-trend squeeze is getting harder to ignore.
Share this:

- CHF/JPY downside stretch hits most extreme levels since 2018
- Prior extreme episodes favoured stronger forward returns
- Hawkish BOJ repricing, record intervention and US support bolster yen
- Long-term support near 188.80 key for any bounce
Waterfall mode
CHF/JPY has gone into something akin to waterfall mode over the past week or so, something of a rare occurrence considering just how respectful the pair has been of known technical levels, as demonstrated on the chart below.
That’s pushed Swissy-yen into extreme oversold territory on the downside, with the ATR 50 stretch and RSI (14) both now at the most extreme readings seen in the daily sample going back to mid-2018.

Source: TradingView
Stretch reaches historic extremes
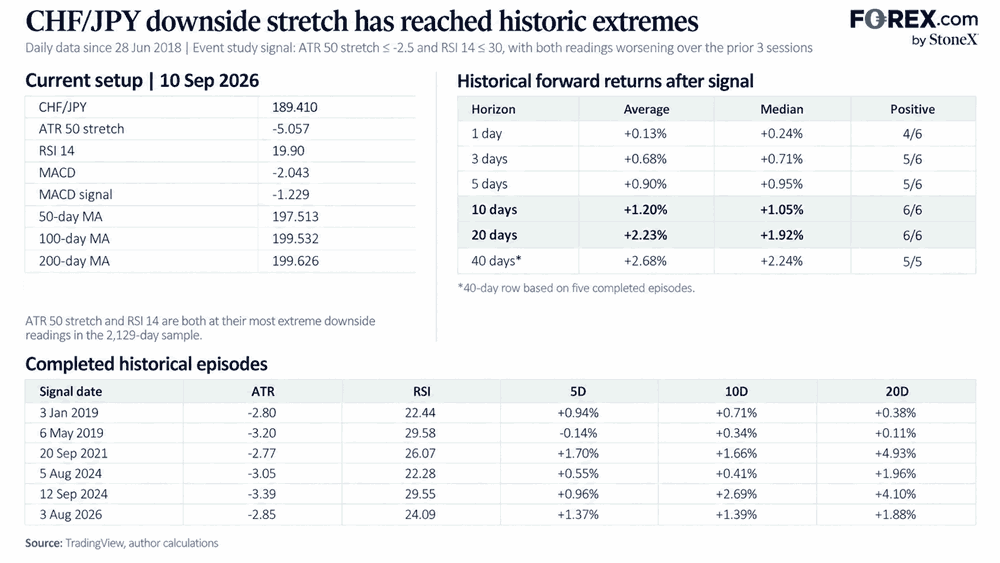
Using daily data going back to June 2018, there have been six completed episodes where the ATR 50 stretch indicator in the bottom pane has fallen beneath -2.5, while RSI (14) was below 30, with both indicators pushing lower into the signal.
While backtesting suggests the initial results were mixed, with Swissy-yen higher only four times out of six one session later, the further out you go, the stronger the historical bias becomes towards a rebound. Five of the six episodes were followed by a higher price three and five trading days later, while all six were higher after 10 and 20 sessions. The average gain was around 1.2% after 10 days and 2.2% after 20.
Source: TradingView
While past performance is not indicative of future returns and does not guarantee the same outcome on this occasion, the current setup is considerably more extreme than any of the thresholds used in that backtest, underlining just how extreme this move has been.
Hawkish BOJ repricing strengthens yen
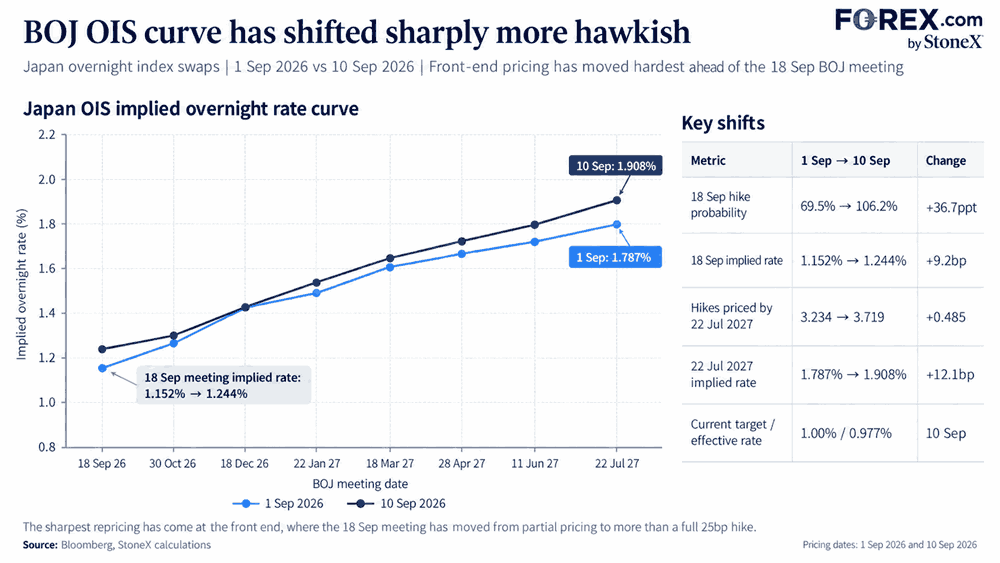
From a fundamental perspective, the yen has had a lot of positives working for it recently, one of which has been a significant hawkish repricing of Japan’s interest rate outlook, as seen in the graphic below.
The implied overnight rate for next Friday’s BOJ meeting has risen from 1.15% at the start of September to 1.24% today, taking pricing for a 25bp hike from around 70% just over a week ago to slightly more than a full quarter-point move.
Further out, markets are now pricing around 3.7 hikes by July next year, up from just over 3.2 at the start of the month.
Source: Bloomberg
Bessent turns the hubris up
Another factor has been an unusually high level of support from the United States for efforts to strengthen the yen. Alongside the ongoing threat of intervention from Japanese authorities, US Treasury Secretary Scott Bessent has expressed extraordinary confidence that policymakers will ultimately get their way, with the level of hubris in his recent remarks almost off the Richter scale.
Bessent had previously said he possessed “asymmetric information” regarding what Japanese policymakers were likely to do. This week, he went a step further, declaring “I am the house now”, saying that when the US and Japan intervened in the yen he had “pretty good insight” into what the BOJ and Japanese policymakers were going to do, before telling traders: “You can bet against me if you want.”
Those extraordinary remarks come after data released this week showed Japanese authorities spent ¥15.39 trillion on yen-buying intervention between late July and late August, the largest amount on record.
When you look at that, it’s understandable why the yen has been so strong recently. But the honest assessment is that it’s still subject to some of the same macro headwinds from energy insecurity and deteriorating terms of trade from high energy prices. As such, you need to ask what else is left out there that can really benefit the yen from here, at least in the short term.
US inflation keeps yen volatility alive
Looking ahead, there is little in the way of major economic data due in either Japan or Switzerland between now and next Friday’s BOJ interest rate decision, providing a relatively clear domestic calendar over the coming week.
However, that doesn’t mean the pair has no looming catalyst that could spark significant volatility, with US PPI out later today and CPI tomorrow carrying the potential to significantly shift the US rates outlook, which in turn could have a meaningful impact on USD/JPY and broader yen volatility.
While most of G10 FX has been as quiet as a church mouse over the past month, the yen has been notably more volatile, while the Swissy has also been relatively active, albeit not to extreme levels.
Bounce risk versus prevailing trend
Discussing long setups here goes entirely against the prevailing trend. While history suggests stretches this extreme have often arrived before counter-trend rallies, I’m not interested in trying to pre-empt a similar outcome yet.
While the oscillators sit at extreme levels, they still indicate downside momentum is building, which would normally favour selling into strength, especially over a longer-term time horizon. The medium and longer-term moving averages are rolling over. The 50-day is sloping lower, so is the 100-day, while the 200-day is now showing signs of joining them, with the shorter averages also crossing beneath it.
Of course, that doesn’t rule out the potential for a counter-trend bounce. But before considering playing for one, I’d be looking first for some form of bottoming signal, whether on the daily chart or on a shorter timeframe such as the hourly or four-hourly.
On the downside, the key area is the intersection of the long-running uptrend dating back to September 2021 with horizontal support around 188.80, a minor level that also acted as support in October last year. That is the support zone I’m watching most closely.
For those looking to play a bounce, a stop could potentially be set beneath that area, while the September 8 low just ahead of 189 provides another nearby reference point depending on entry level and risk tolerance.
If a bottoming signal does emerge, upside levels of note include 190.54, which acted as both support and resistance late last year, then 192.70 and 194.57. Looking much higher than that feels ambitious in the near term.
Of course, if the September 2021 uptrend and horizontal support at 188.80 buckle, that may embolden more bears to join the move. In that scenario, 187.58, which was a breakout level in September last year, followed by 186 and 184, become the next downside levels of note.


Open an account in minutes
Experience award-winning platforms with fast and secure execution, and enjoy tight spreads from 0.5 pts on FX and 0.3 pts on indices.
Economic calendar
Web Trader platform
Our sophisticated web-based platform is packed with features.
Related articles
Dow Jones forecast: Stock markets under pressure from multiple sources
When looking at the major tech-heavy US indices like the S&P 500 or the Nasdaq 100, you wouldn’t think that the stock market is particularly weak. Yet, beneath the surface, the market is far from healthy right now. Investors are evidently just piling into the big tech and AI names, and as a result, market breadth is deteriorating. Other indices like the small cap Russell 2000 and the Dow Jones are starting to reflect that weakness.

Tankan Backs BOJ Tightening, but Yen Rate Expectations Ease
Japan’s Tankan supports further BOJ tightening, although softer rate expectations could limit support for the Japanese yen.


Nikkei breakout accelerates as yen weakness returns
Nikkei has started October with a powerful breakout, helped by renewed yen weakness and strong upside momentum
This report is intended for general circulation only. It should not be construed as a recommendation, or an offer (or solicitation of an offer) to buy or sell any financial products. The information provided does not take into account your specific investment objectives, financial situation or particular needs. Before you act on any recommendation that may be contained in this report, independent advice ought to be sought from a financial adviser regarding the suitability of the investment product, taking into account your specific investment objectives, financial situation or particular needs.
StoneX Financial Pte. Ltd., may distribute reports produced by its respective foreign entities or affiliates within the StoneX group of companies or third parties pursuant to an arrangement under Regulation 32C of the Financial Advisers Regulations. Where the report is distributed to a person in Singapore who is not an accredited investor, expert investor or an institutional investor (as defined in the Securities Futures Act), StoneX Financial Pte. Ltd. accepts legal responsibility to such persons for the contents of the report only to the extent required by law. Singapore recipients should contact StoneX Financial Pte. Ltd. at 6826 9988 for matters arising from, or in connection with the report.
In the case of all other recipients of this report, to the extent permitted by applicable laws and regulations neither StoneX Financial Pte. Ltd. nor its associated companies will be responsible or liable for any loss or damage incurred arising out of, or in connection with, any use of the information contained in this report and all such liability is hereby expressly disclaimed. No representation or warranty is made, express or implied, that the content of this report is complete or accurate.
StoneX Financial Pte. Ltd. is not under any obligation to update this report.
Trading CFDs carries a high level of risk that may not be suitable for some investors. Consider your investment objectives, level of experience, financial resources, risk appetite and other relevant circumstances carefully. The possibility exists that you could lose some or all of your investments, including your initial deposits. If in doubt, please seek independent expert advice. Visit www.forex.com/en-sg/terms-and-policies for the complete Risk Disclosure Statement.