



China Real Estate Developers Remain Under Pressure
China's house prices index in 100 cities rose 0.53% on month in June, rising for the fourth month. Besides, China's second hand home sales rose 20% on year. Above economic data suggests that the real estate market in China is recovering after the outbreak of COVID-19. However, the stock in this industry does not perform as good as the economic data.
Share this:
China's house prices index in 100 cities rose 0.53% on month in June, rising for the fourth month. Besides, China's second hand home sales rose 20% on year. Above economic data suggests that the real estate market in China is recovering after the outbreak of COVID-19. However, the stock in this industry does not perform as good as the economic data.
China Evergrande (3333.HK) Breaking below of rising trend line

Source: GAIN Capital, TradingView
Recently, China Evergrande announced that the contracted sales in the first six months of 2020 was up 23.8% on year to 348.84 billion yuan.
The stock price peformance of Evergrande is one of the strongest stocks in China real estate industry. The stock soard around 180% from March low to HK$28.00 in July. After that, the prices fell around 25% from July's high.
On a daily chart, the stock broke below the 20-day moving average after posting an inverted V-shape reversal pattern.
In addition, the prices broke below the rising trend line drawn from May.
To conclude, as long as the resistance level at HK#23.20 (38.2% fibonacci retracement) is not surpassed, the stock should consider a drop to the overlapping support levels at HK$19.20 and HK$16.75 respectively.
China Vanke (2202.HK): Under pressure

Source: GAIN Capital, TradingView
Recently, China Vanke reported that contracted sales from January to June dropped 4% on year to 320.48 billion yuan.
From a technical point of view, the stock sharply retreated from July's high at HK$29.80 on a daily chart.
Currently, the prices returned to the level below both 20-day and 50-day moving averages.
The relative strength index broke below the neutrality level at 50 and the rising trend line drawn from March.
Bearish readers could set the nearest resistance level at HK$26.55 (the previous high), while the support levels would be located at HK$23.85 (the low of May) and HK$21.70 (the low of March).
Country Garden (2007): Bearish trend remains

Source: GAIN Capital, TradingView
On a daily chart, the stock reversed course to the downside after a high close on July 6.
Since then it has accelerated to the downside.
Currenlty it has returned to levels below both 20-day and 50-day moving average.
The technical configuration is favoring a Bearish Bias.
Downside support would only appear at HK$9.45 (intraday low of June 30) and HK$9.08 (intraday low of May 25).
Bearish buyers should take the level of HK$10.48 as the Key Resistance (Stop-loss) level.
China Evergrande (3333.HK) Breaking below of rising trend line
Source: GAIN Capital, TradingView
Recently, China Evergrande announced that the contracted sales in the first six months of 2020 was up 23.8% on year to 348.84 billion yuan.
The stock price peformance of Evergrande is one of the strongest stocks in China real estate industry. The stock soard around 180% from March low to HK$28.00 in July. After that, the prices fell around 25% from July's high.
On a daily chart, the stock broke below the 20-day moving average after posting an inverted V-shape reversal pattern.
In addition, the prices broke below the rising trend line drawn from May.
To conclude, as long as the resistance level at HK#23.20 (38.2% fibonacci retracement) is not surpassed, the stock should consider a drop to the overlapping support levels at HK$19.20 and HK$16.75 respectively.
China Vanke (2202.HK): Under pressure
Source: GAIN Capital, TradingView
Recently, China Vanke reported that contracted sales from January to June dropped 4% on year to 320.48 billion yuan.
From a technical point of view, the stock sharply retreated from July's high at HK$29.80 on a daily chart.
Currently, the prices returned to the level below both 20-day and 50-day moving averages.
The relative strength index broke below the neutrality level at 50 and the rising trend line drawn from March.
Bearish readers could set the nearest resistance level at HK$26.55 (the previous high), while the support levels would be located at HK$23.85 (the low of May) and HK$21.70 (the low of March).
Country Garden (2007): Bearish trend remains
Source: GAIN Capital, TradingView
On a daily chart, the stock reversed course to the downside after a high close on July 6.
Since then it has accelerated to the downside.
Currenlty it has returned to levels below both 20-day and 50-day moving average.
The technical configuration is favoring a Bearish Bias.
Downside support would only appear at HK$9.45 (intraday low of June 30) and HK$9.08 (intraday low of May 25).
Bearish buyers should take the level of HK$10.48 as the Key Resistance (Stop-loss) level.
China's house prices index in 100 cities rose 0.53% on month in June, rising for the fourth month. Besides, China's second hand home sales rose 20% on year. Above economic data suggests that the real estate market in China is recovering after the outbreak of COVID-19. However, the stock in this industry does not perform as good as the economic data.
China Evergrande (3333.HK) Breaking below of rising trend line

Source: GAIN Capital, TradingView
Recently, China Evergrande announced that the contracted sales in the first six months of 2020 was up 23.8% on year to 348.84 billion yuan.
The stock price peformance of Evergrande is one of the strongest stocks in China real estate industry. The stock soard around 180% from March low to HK$28.00 in July. After that, the prices fell around 25% from July's high.
On a daily chart, the stock broke below the 20-day moving average after posting an inverted V-shape reversal pattern.
In addition, the prices broke below the rising trend line drawn from May.
To conclude, as long as the resistance level at HK#23.20 (38.2% fibonacci retracement) is not surpassed, the stock should consider a drop to the overlapping support levels at HK$19.20 and HK$16.75 respectively.
China Vanke (2202.HK): Under pressure

Source: GAIN Capital, TradingView
Recently, China Vanke reported that contracted sales from January to June dropped 4% on year to 320.48 billion yuan.
From a technical point of view, the stock sharply retreated from July's high at HK$29.80 on a daily chart.
Currently, the prices returned to the level below both 20-day and 50-day moving averages.
The relative strength index broke below the neutrality level at 50 and the rising trend line drawn from March.
Bearish readers could set the nearest resistance level at HK$26.55 (the previous high), while the support levels would be located at HK$23.85 (the low of May) and HK$21.70 (the low of March).
Country Garden (2007): Bearish trend remains
Source: GAIN Capital, TradingView
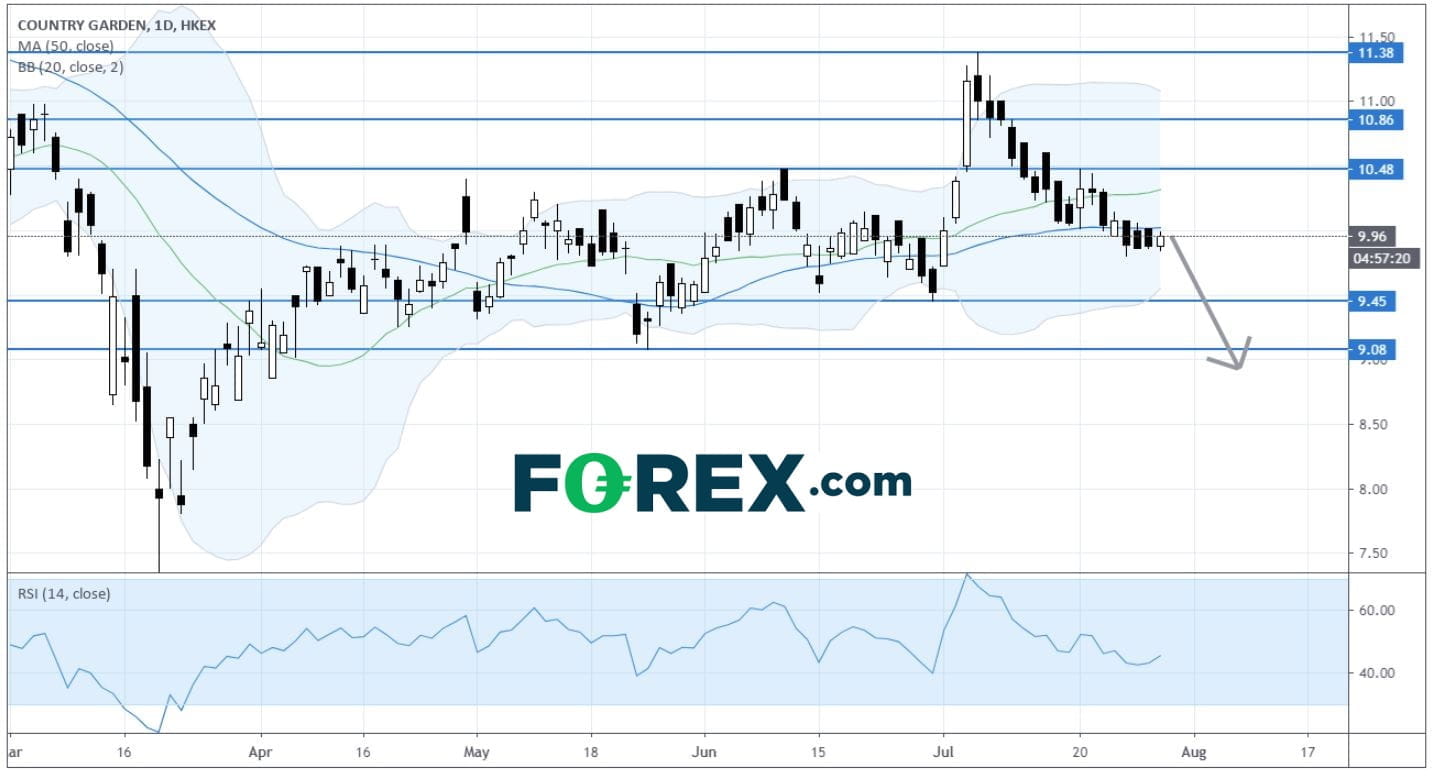
On a daily chart, the stock reversed course to the downside after a high close on July 6.
Since then it has accelerated to the downside.
Currenlty it has returned to levels below both 20-day and 50-day moving average.
The technical configuration is favoring a Bearish Bias.
Downside support would only appear at HK$9.45 (intraday low of June 30) and HK$9.08 (intraday low of May 25).
Bearish buyers should take the level of HK$10.48 as the Key Resistance (Stop-loss) level.
China Evergrande (3333.HK) Breaking below of rising trend line
Source: GAIN Capital, TradingView
Recently, China Evergrande announced that the contracted sales in the first six months of 2020 was up 23.8% on year to 348.84 billion yuan.
The stock price peformance of Evergrande is one of the strongest stocks in China real estate industry. The stock soard around 180% from March low to HK$28.00 in July. After that, the prices fell around 25% from July's high.
On a daily chart, the stock broke below the 20-day moving average after posting an inverted V-shape reversal pattern.
In addition, the prices broke below the rising trend line drawn from May.
To conclude, as long as the resistance level at HK#23.20 (38.2% fibonacci retracement) is not surpassed, the stock should consider a drop to the overlapping support levels at HK$19.20 and HK$16.75 respectively.
China Vanke (2202.HK): Under pressure
Source: GAIN Capital, TradingView
Recently, China Vanke reported that contracted sales from January to June dropped 4% on year to 320.48 billion yuan.
From a technical point of view, the stock sharply retreated from July's high at HK$29.80 on a daily chart.
Currently, the prices returned to the level below both 20-day and 50-day moving averages.
The relative strength index broke below the neutrality level at 50 and the rising trend line drawn from March.
Bearish readers could set the nearest resistance level at HK$26.55 (the previous high), while the support levels would be located at HK$23.85 (the low of May) and HK$21.70 (the low of March).
Country Garden (2007): Bearish trend remains
Source: GAIN Capital, TradingView
On a daily chart, the stock reversed course to the downside after a high close on July 6.
Since then it has accelerated to the downside.
Currenlty it has returned to levels below both 20-day and 50-day moving average.
The technical configuration is favoring a Bearish Bias.
Downside support would only appear at HK$9.45 (intraday low of June 30) and HK$9.08 (intraday low of May 25).
Bearish buyers should take the level of HK$10.48 as the Key Resistance (Stop-loss) level.
Latest market news




Open an account in minutes
Experience award-winning platforms with fast and secure execution, and enjoy tight spreads from 0.5 pts on FX and 0.3 pts on indices.
Economic calendar
Web Trader platform
Our sophisticated web-based platform is packed with features.
Related articles

ASX 200 Slides as Oil, Yields and Rate Risks Hit Sentiment
The ASX 200 suffered its worst week in six months as surging oil, higher bond yields and renewed rate-hike bets drove a broad risk-off move.


S&P 500, Nasdaq, Dow Forecast: Rising Yields Test Rally Ahead of Nvidia, Fed 8 22 2026
S&P 500, Nasdaq and Dow test key technical levels as momentum fades, raising the risk of a deeper correction heading into a pivotal week.


Magnificent Seven Earnings Preview: Can Big Tech Reclaim AI Leadership?
The Magnificent Seven enter earnings with far more divided performance than in previous years, as investors increasingly distinguish between companies supplying the AI buildout and those funding it - what does that mean heading into earnings season?

This report is intended for general circulation only. It should not be construed as a recommendation, or an offer (or solicitation of an offer) to buy or sell any financial products. The information provided does not take into account your specific investment objectives, financial situation or particular needs. Before you act on any recommendation that may be contained in this report, independent advice ought to be sought from a financial adviser regarding the suitability of the investment product, taking into account your specific investment objectives, financial situation or particular needs.
StoneX Financial Pte. Ltd., may distribute reports produced by its respective foreign entities or affiliates within the StoneX group of companies or third parties pursuant to an arrangement under Regulation 32C of the Financial Advisers Regulations. Where the report is distributed to a person in Singapore who is not an accredited investor, expert investor or an institutional investor (as defined in the Securities Futures Act), StoneX Financial Pte. Ltd. accepts legal responsibility to such persons for the contents of the report only to the extent required by law. Singapore recipients should contact StoneX Financial Pte. Ltd. at 6826 9988 for matters arising from, or in connection with the report.
In the case of all other recipients of this report, to the extent permitted by applicable laws and regulations neither StoneX Financial Pte. Ltd. nor its associated companies will be responsible or liable for any loss or damage incurred arising out of, or in connection with, any use of the information contained in this report and all such liability is hereby expressly disclaimed. No representation or warranty is made, express or implied, that the content of this report is complete or accurate.
StoneX Financial Pte. Ltd. is not under any obligation to update this report.
Trading CFDs carries a high level of risk that may not be suitable for some investors. Consider your investment objectives, level of experience, financial resources, risk appetite and other relevant circumstances carefully. The possibility exists that you could lose some or all of your investments, including your initial deposits. If in doubt, please seek independent expert advice. Visit www.forex.com/en-sg/terms-and-policies for the complete Risk Disclosure Statement.