





Coronavirus Goes Global Brent Blasted by Bears
Brent is starting to look like its ready to begin another leg lower...
Share this:

As my colleague Joe Perry noted earlier this morning (and indeed late last week as well), the spread of coronavirus remains the single biggest driver for day-to-day movements across global markets.
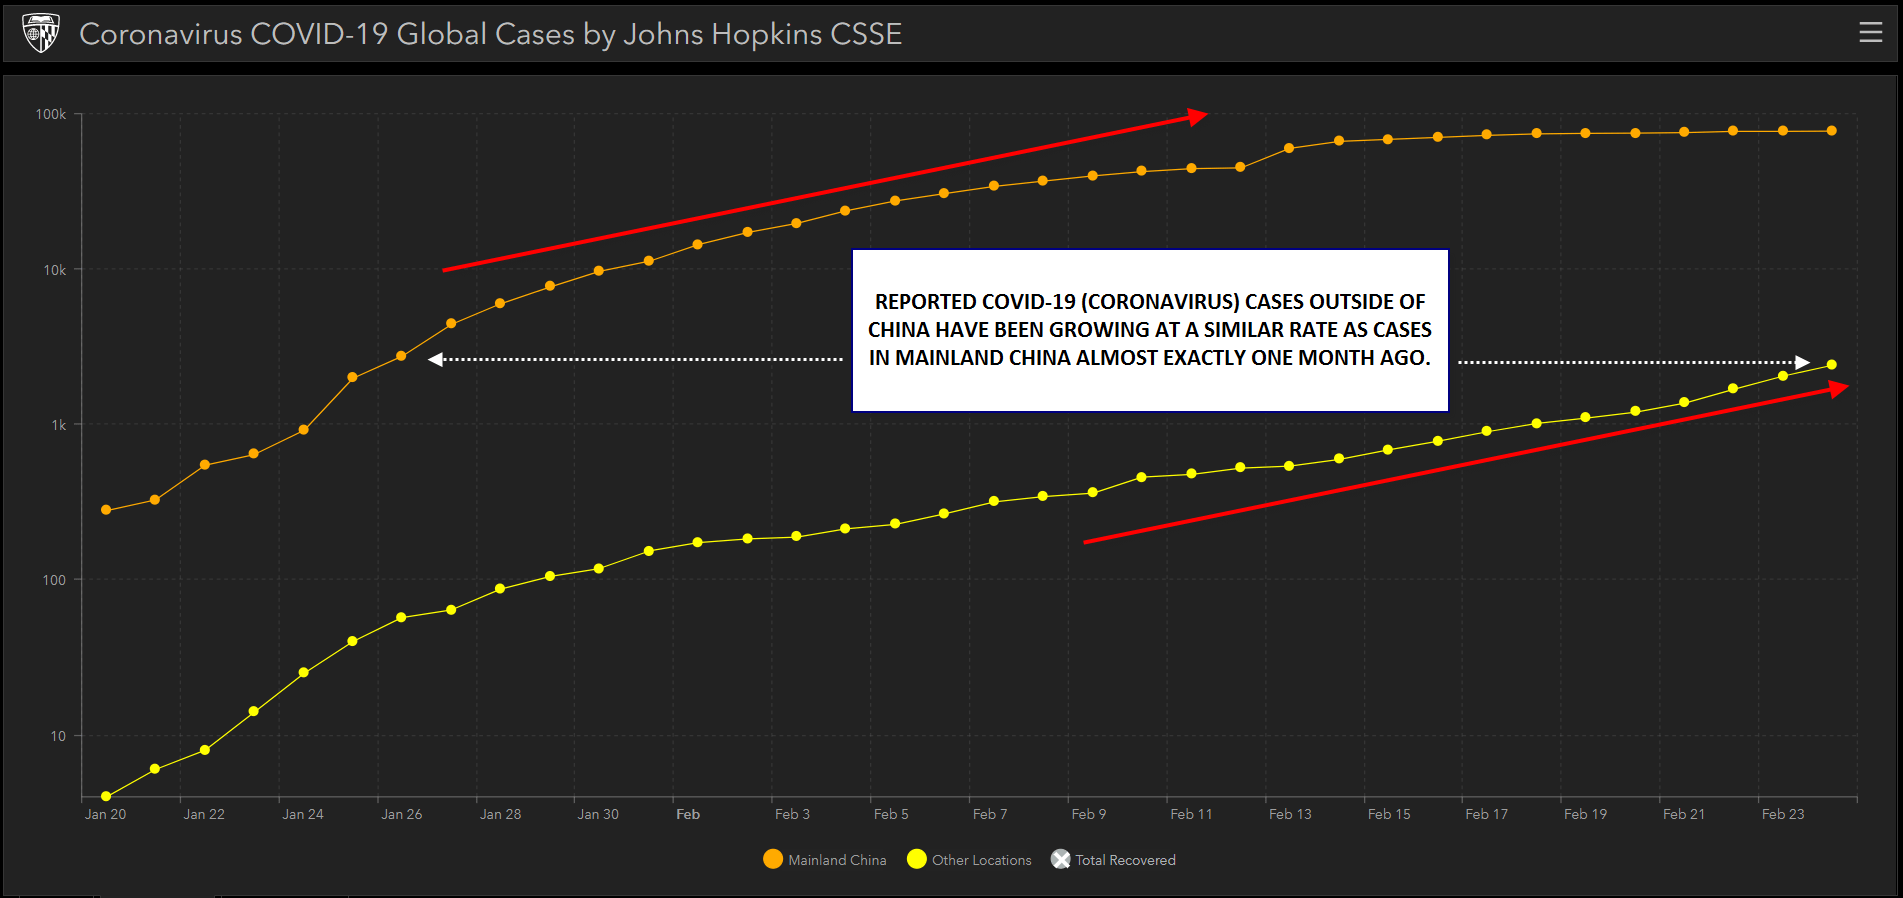
While the spread of the virus in China is showing signs of stabilizing, at least to the extent official numbers can be believed, traders have been alarmed by the spread of the virus in other countries. The absolute number of cases outside of mainland China remain low, but the exponential growth in the number of international cases of COVID-19 is starting to look eerily similar to the timeline we saw on mainland China almost exactly 1 month ago:
Source: Johns Hopkins CSSE, GAIN Capital
Compounded with the already dramatic interruptions to global supply chains in China, traders fear that a rapid spread of the disease to other major economies could be enough to temporarily tip global economic growth into contraction in the first half of the year. Japan, Italy/the Eurozone, and South Korea, where cases grew from 30 to 750 in the last week alone, are the current hotspots to watch.
Of course, the spread of the virus is impacting every major market, but oil has seen one of the strongest reactions. Crude benchmarks in both the US and UK are trading down by over -4% so far today. Focusing on Brent Crude, prices fell roughly -25% peak-to-trough in a month from early January to early February, and after staging a fierce recovery rally over the last two weeks, Brent is starting to look like its ready to begin another leg lower.
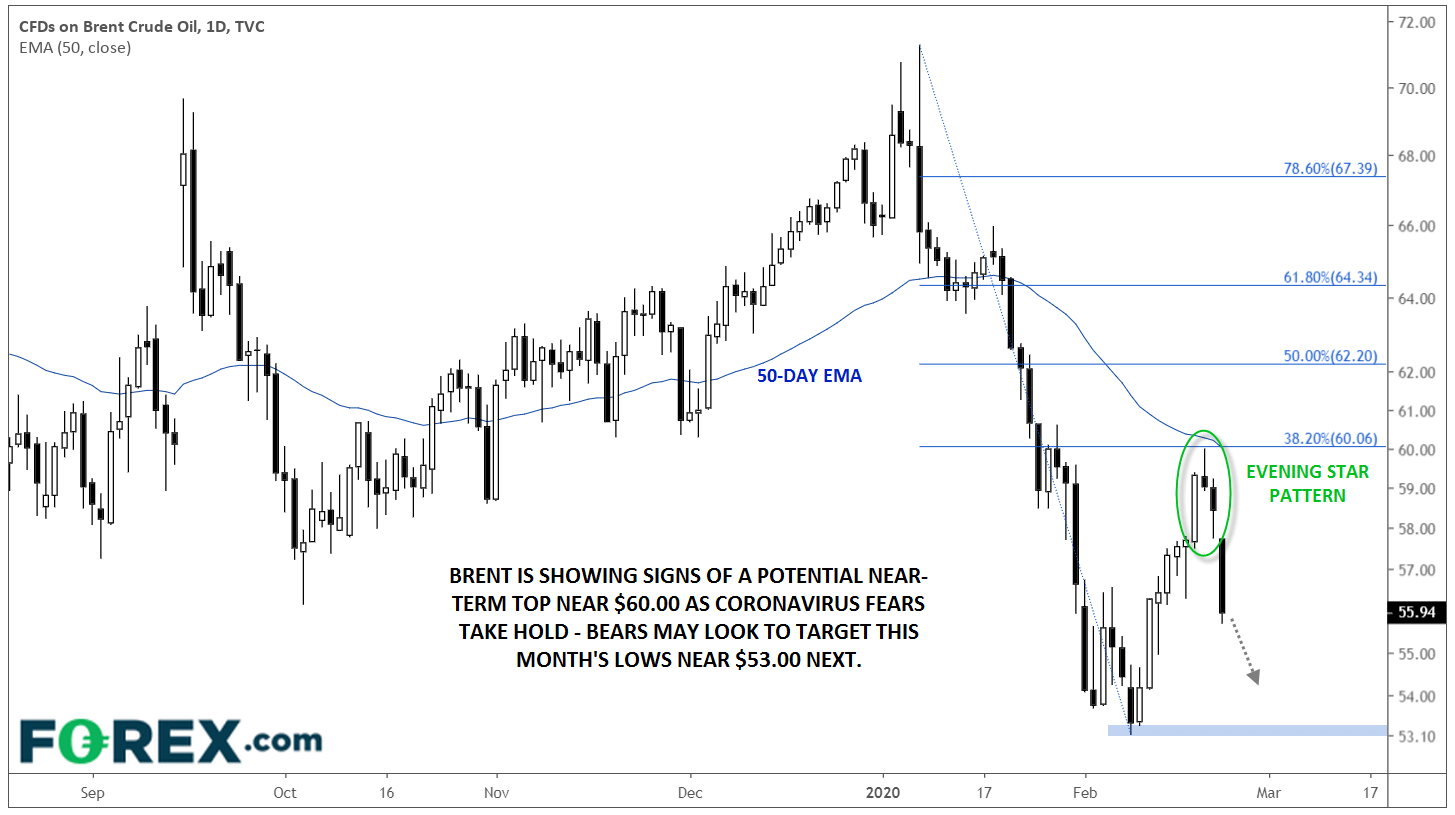
Technically speaking, Brent has only been able to recover to the shallow 38.2% Fibonacci retracement level of the previous drop, signaling that sellers remain in control. This level coincides with the 50-day exponential moving average and key psychological level at $60.00, lending it even more significance.
Over the last three days of last week, oil prices carved out a “evening star” candlestick pattern. For the uninitiated, an evening star formation is relatively rare candlestick formation created by a long bullish candle, followed a small-bodied reversal candle near the top of the first candle and completed by a long-bodied bearish candle. It represents a transition from short-term bullish to bearish momentum and often marks a near-term top in the market.
Source: TradingView, GAIN Capital
Moving forward, continued worrisome headlines around the spread of coronavirus could take Brent crude oil down to retest the month’s lows near 53.00, which also represents the lowest price that oil has traded at since late 2018. If that level gives way, a continuation toward the 2.5-year lows near $50.00 may come next. At this point, the market’s near-term bearish bias will remain intact as long as prices remain below the key $60.00 level.
As my colleague Joe Perry noted earlier this morning (and indeed late last week as well), the spread of coronavirus remains the single biggest driver for day-to-day movements across global markets.
While the spread of the virus in China is showing signs of stabilizing, at least to the extent official numbers can be believed, traders have been alarmed by the spread of the virus in other countries. The absolute number of cases outside of mainland China remain low, but the exponential growth in the number of international cases of COVID-19 is starting to look eerily similar to the timeline we saw on mainland China almost exactly 1 month ago:
Source: Johns Hopkins CSSE, GAIN Capital
Compounded with the already dramatic interruptions to global supply chains in China, traders fear that a rapid spread of the disease to other major economies could be enough to temporarily tip global economic growth into contraction in the first half of the year. Japan, Italy/the Eurozone, and South Korea, where cases grew from 30 to 750 in the last week alone, are the current hotspots to watch.
Of course, the spread of the virus is impacting every major market, but oil has seen one of the strongest reactions. Crude benchmarks in both the US and UK are trading down by over -4% so far today. Focusing on Brent Crude, prices fell roughly -25% peak-to-trough in a month from early January to early February, and after staging a fierce recovery rally over the last two weeks, Brent is starting to look like its ready to begin another leg lower.
Technically speaking, Brent has only been able to recover to the shallow 38.2% Fibonacci retracement level of the previous drop, signaling that sellers remain in control. This level coincides with the 50-day exponential moving average and key psychological level at $60.00, lending it even more significance.
Over the last three days of last week, oil prices carved out a “evening star” candlestick pattern. For the uninitiated, an evening star formation is relatively rare candlestick formation created by a long bullish candle, followed a small-bodied reversal candle near the top of the first candle and completed by a long-bodied bearish candle. It represents a transition from short-term bullish to bearish momentum and often marks a near-term top in the market.
Source: TradingView, GAIN Capital
Moving forward, continued worrisome headlines around the spread of coronavirus could take Brent crude oil down to retest the month’s lows near 53.00, which also represents the lowest price that oil has traded at since late 2018. If that level gives way, a continuation toward the 2.5-year lows near $50.00 may come next. At this point, the market’s near-term bearish bias will remain intact as long as prices remain below the key $60.00 level.
Related tags:

Open an account in minutes
Experience award-winning platforms with fast and secure execution, and enjoy tight spreads from 0.5 pts on FX and 0.3 pts on indices.
Economic calendar
Web Trader platform
Our sophisticated web-based platform is packed with features.
Related articles

Oil Quietly Hands the Fed a Reason to Stay Hawkish
Oil prices and the U.S. dollar are both on the front foot as elevated energy costs feed Fed warnings that inflation may prove sticky.


Wall Street Forecast: DJIA falls as treasury yields hit new highs and ahead of the Trump-Xi summit
U.S. stocks are falling, further extending losses from the previous session, as oil prices move higher alongside Treasury yields and caution reigns ahead of the summit between President Trump and Xi Jinping.


Oil, USD/JPY Forecast: Two trades to watch
Oil recovers above $90 amid a lack of progress in US-Iran diplomacy. USD/JPY rises to 158 on widening Fed-BoJ policy outlook.
This report is intended for general circulation only. It should not be construed as a recommendation, or an offer (or solicitation of an offer) to buy or sell any financial products. The information provided does not take into account your specific investment objectives, financial situation or particular needs. Before you act on any recommendation that may be contained in this report, independent advice ought to be sought from a financial adviser regarding the suitability of the investment product, taking into account your specific investment objectives, financial situation or particular needs.
StoneX Financial Pte. Ltd., may distribute reports produced by its respective foreign entities or affiliates within the StoneX group of companies or third parties pursuant to an arrangement under Regulation 32C of the Financial Advisers Regulations. Where the report is distributed to a person in Singapore who is not an accredited investor, expert investor or an institutional investor (as defined in the Securities Futures Act), StoneX Financial Pte. Ltd. accepts legal responsibility to such persons for the contents of the report only to the extent required by law. Singapore recipients should contact StoneX Financial Pte. Ltd. at 6826 9988 for matters arising from, or in connection with the report.
In the case of all other recipients of this report, to the extent permitted by applicable laws and regulations neither StoneX Financial Pte. Ltd. nor its associated companies will be responsible or liable for any loss or damage incurred arising out of, or in connection with, any use of the information contained in this report and all such liability is hereby expressly disclaimed. No representation or warranty is made, express or implied, that the content of this report is complete or accurate.
StoneX Financial Pte. Ltd. is not under any obligation to update this report.
Trading CFDs carries a high level of risk that may not be suitable for some investors. Consider your investment objectives, level of experience, financial resources, risk appetite and other relevant circumstances carefully. The possibility exists that you could lose some or all of your investments, including your initial deposits. If in doubt, please seek independent expert advice. Visit www.forex.com/en-sg/terms-and-policies for the complete Risk Disclosure Statement.