



DAX, FTSE and China A50 technical analysis: Technical Tuesday - March 2, 2024
Welcome to the first edition of Technical Tuesday for 2024. In this report, we will get technical on the DAX, FTSE and China A50.
Share this:

- DAX technical analysis: German index could hit new highs
- FTSE technical analysis: UK stocks showing encouraging signs
- China A50 technical analysis: Chinese stocks near a bottom finally?
Welcome to the first edition of Technical Tuesday for 2024. In this report, we will get technical on the DAX, FTSE and China A50.
DAX technical analysis: German index could hit new highs
The DAX hit repeated record highs, reaching a peak of just over 17000 in mid-December, before drifting lower in the final days of the year. The German index started the first trading day of 2024 on the front-foot, before losing momentum alongside US indices. Clearly, the trend is still pretty much bullish and it remains in a “buy-the-dip” rather than “sell-the-rip” mode, until the charts tell us otherwise.
The key support area that needs to get defended is that shaded blue area on the chart, between 16286 to 16532. This near-250-point range is where the highs of 2021 and 2022, and that of July 2023, were made. Once strong resistance, this area now needs to turn into support to keep the bulls happy.
For as long as the above-mentioned support area holds, we will be anticipating the German DAX index to hit new highs this year. The next bullish target is at 17004, the December 2023 all-time high, followed by the 127.2 and 161.8 percent Fibonacci extension levels of the drop from July 2023 high, at 17061 and 17733, respectively.
If the index fails to hold support in that 16286 to 16532 range, then we could see a sharp correction towards the next big support level at 16,000, which was the base of the breakout at the end of November.
FTSE technical analysis: UK stocks showing encouraging signs
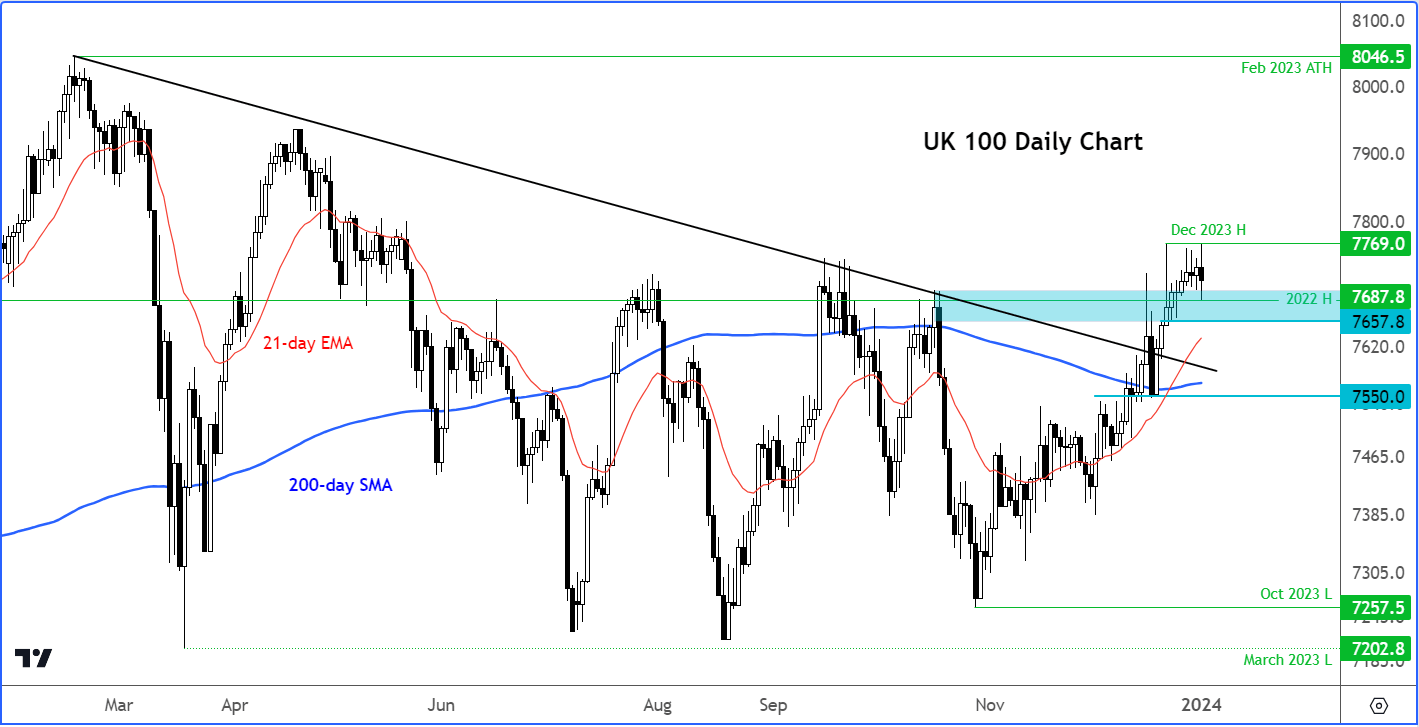
The broken trend line on the FTSE means the path of least resistance is to the upside despite a sluggish start to the new year. At the time of writing, the UK benchmark index was testing key support, starting at 7688ish. This level marks the high from 2022, a level which proved to be a tough nut to crack on multiple occasions last year, before finally giving way in December. From a bullish point of view, an ideal scenario would be for the index to hold above this level now, in order to gear up for another breakout.
From here, the next upside target is the December 2023 high at just below 7770, followed by the February 2023 high of 8046.
On the downside, a convincing break below 7688 could pave the way towards the 200-day average at 7669.


China A50 technical analysis: Chinese stocks near a bottom finally?
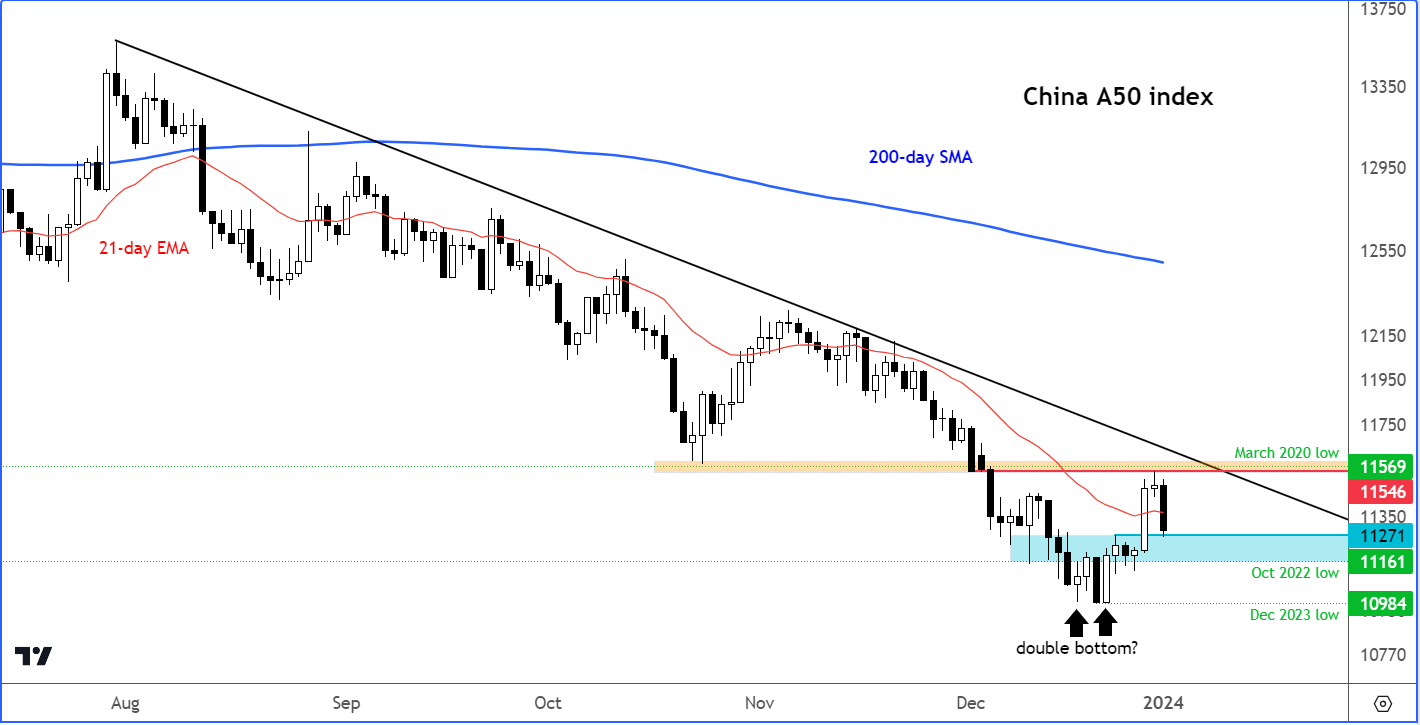
While the rest of the global stock indices hit repeated multi-year or all-time highs, Chinese markets repeatedly unperformed throughout 2023. The China A50 index broke below the pandemic-low of 11569 that was hit in March 2020, before going on to take out the October 2022 low at 11161. However, late in the month of December, the index showed some signs of life, and the bulls were able to push the index back above the October 2022 low. This was a possible bullish reversal sign, as too was the fact it had created a double bottom around 109884, prior to staging a rally off the multi-year lows.
Moving forward, the bulls will want the index to hold around the current level of around 11270ish to 11161ish (shaded blue area on the chart). A bounce from around here in the next day or two would be very ideal. Failure to find support means the bulls will have to wait a little longer before the index potentially finds a bottom.
For confirmation, we will need to see a break above the bearish trend line and key resistance around 11546-11570 area (March 2020 low).
Source for all charts used in this article: TradingVIew.com
-- Written by Fawad Razaqzada, Market Analyst
Follow Fawad on Twitter @Trader_F_R
How to trade with City Index
You can trade with City Index by following these four easy steps:
- Open an account, or log in if you’re already a customer
• Open an account in the UK
• Open an account in Australia
• Open an account in Singapore
- Search for the company you want to trade in our award-winning platform
- Choose your position and size, and your stop and limit levels
- Place the trade
Related tags:
Latest market news




Open an account in minutes
Experience award-winning platforms with fast and secure execution, and enjoy tight spreads from 0.5 pts on FX and 0.3 pts on indices.
Economic calendar
Web Trader platform
Our sophisticated web-based platform is packed with features.
Related articles
Gold Q4 2026 outlook: Resilience in the face of rallying dollar and yields
As we headed towards the latter stages of Q3 and into Q4, the Fed had just hiked rates in a hawkish FOMC meeting, while the likes of the ECB and BoJ had also tightened their respective policies. Oil prices remained elevated amid the prolonged US-Iran conflict. Meanwhile, bond yields were breaking out, and the dollar was higher across the board. Yet, remarkably, gold was still holding in the positive territory for the third quarter, even if it had weakened somewhat in September.

Oil Quietly Hands the Fed a Reason to Stay Hawkish
Oil prices and the U.S. dollar are both on the front foot as elevated energy costs feed Fed warnings that inflation may prove sticky.

S&P 500 forecast: Stocks extend drop as correction risks grow
US and global equity markets have extended Wednesday’s sell-off, with Wall Street opening lower after a weak handover from Asia and Europe. The deterioration in risk appetite has been spreading across global markets. The dollar was firmer, Treasury yields were holding onto yesterday’s gains, while gold, silver and bitcoin were all under pressure alongside equities and major currencies.
This report is intended for general circulation only. It should not be construed as a recommendation, or an offer (or solicitation of an offer) to buy or sell any financial products. The information provided does not take into account your specific investment objectives, financial situation or particular needs. Before you act on any recommendation that may be contained in this report, independent advice ought to be sought from a financial adviser regarding the suitability of the investment product, taking into account your specific investment objectives, financial situation or particular needs.
StoneX Financial Pte. Ltd., may distribute reports produced by its respective foreign entities or affiliates within the StoneX group of companies or third parties pursuant to an arrangement under Regulation 32C of the Financial Advisers Regulations. Where the report is distributed to a person in Singapore who is not an accredited investor, expert investor or an institutional investor (as defined in the Securities Futures Act), StoneX Financial Pte. Ltd. accepts legal responsibility to such persons for the contents of the report only to the extent required by law. Singapore recipients should contact StoneX Financial Pte. Ltd. at 6826 9988 for matters arising from, or in connection with the report.
In the case of all other recipients of this report, to the extent permitted by applicable laws and regulations neither StoneX Financial Pte. Ltd. nor its associated companies will be responsible or liable for any loss or damage incurred arising out of, or in connection with, any use of the information contained in this report and all such liability is hereby expressly disclaimed. No representation or warranty is made, express or implied, that the content of this report is complete or accurate.
StoneX Financial Pte. Ltd. is not under any obligation to update this report.
Trading CFDs carries a high level of risk that may not be suitable for some investors. Consider your investment objectives, level of experience, financial resources, risk appetite and other relevant circumstances carefully. The possibility exists that you could lose some or all of your investments, including your initial deposits. If in doubt, please seek independent expert advice. Visit www.forex.com/en-sg/terms-and-policies for the complete Risk Disclosure Statement.