



EUR/USD 1.1500 Bounce – Will Euro Bears React at Resistance?
EUR/USD has continued to hold above the 1.1500 level and this is a key component for USD trends as we push into the end of the year.
Share this:

EUR/USD put in a clean test of the 1.1500 handle last week and that’s so far led to a bounce this week. The big question now is whether sellers will defend the bearish structure on the daily chart that’s built since the start of the Fed’s rate cuts two months ago.

You find out what a trend is made of during the counter-trend episodes. Do sellers come in to defend lower-highs or are they cautious of a continued run through resistance and possible stop levels to the point where they try to remain patient, instead letting buyers push up for higher-highs.
This can often happen when a major level of support is encountered or re-encountered for the first time in a while, as that support is reasonably the top-end of what a seller might expect for a profit target and that limits perceived upside potential. So getting sloppy on entry seems riskier than usual as the potential reward for ‘being right’ is more limited.
When resistance comes in, however, there’s now an area of interest for stop loss orders, and from that distance down to the obvious support, there’s a possible risk-reward ratio that can be considered.
But one must consider – this is a constantly shifting variable: As price drops from resistance and gets closer to that very obvious support, the possible risk-reward shifts and becomes less attractive, as the risk outlay to get stops above resistance and reward targets down for a re-test of support grow narrower.
And then, as a short-term support level comes into play, the other side of the matter comes into the picture: Can longs then look at that short-term support for a push back into resistance, and, perhaps even, a higher-high?
That’s what’s happened so far this morning in EUR/USD to continue the saga of this week’s price action.
Last Friday, EUR/USD tested the 1.1500 area which is a major level in the pair, historically speaking. The first test below that price back in November failed and buyers ran a rally all the way up to 1.1656. Sellers came in before the prior lower-high, however, and that retained bearish structure on the daily which allowed for another run down to the 1.1500 handle, which showed last week.
The 1.1500 level traded on Thursday and held the low and then sellers got a bit more aggressive on Friday and were able to breach that 1.1500 level slightly: but similarly failing to drive the trend. And as I looked at in yesterday’s webinar, that’s opened the door for a continued bounce on shorter-terms that continues today.
EUR/USD Daily Chart
Chart prepared by James Stanley; data derived from Tradingview
On the above chart I used a few red boxes to illustrate turns and these are accented by groupings of wicks on the daily chart. This highlights that reaction mentioned earlier in the article, where buyers come in for a ‘perceived value’ at support like what showed around the 1.1500 level and sellers come in around resistance to hold lower-highs, thereby continuing the broader trend.
But this can be seen on shorter-terms, as well, with the caveat that shorter-term charts are smaller sample sizes and thusly, prone to a bit more noise. But as looked at in the webinar yesterday, bulls had already made a move for a short-term higher-high to go along with a higher-low from that 1.1500 level, and that highlighted the 1.1593 Fibonacci level as the next obvious spot of resistance.
That was tested earlier this morning, and sellers hit it hard, driving price all the way down to prior resistance of 1.1550.
But that’s when another shift began to show: Bulls showed up for another ‘perceived value’ and drove price right back up to resistance.
Again, the perceived risk-reward for price action structure is a constantly shifting variable and as this example presents, there can often be differing drives shown on different time frames, and this is why risk management is so utterly important.
EUR/USD Four-Hour Price Chart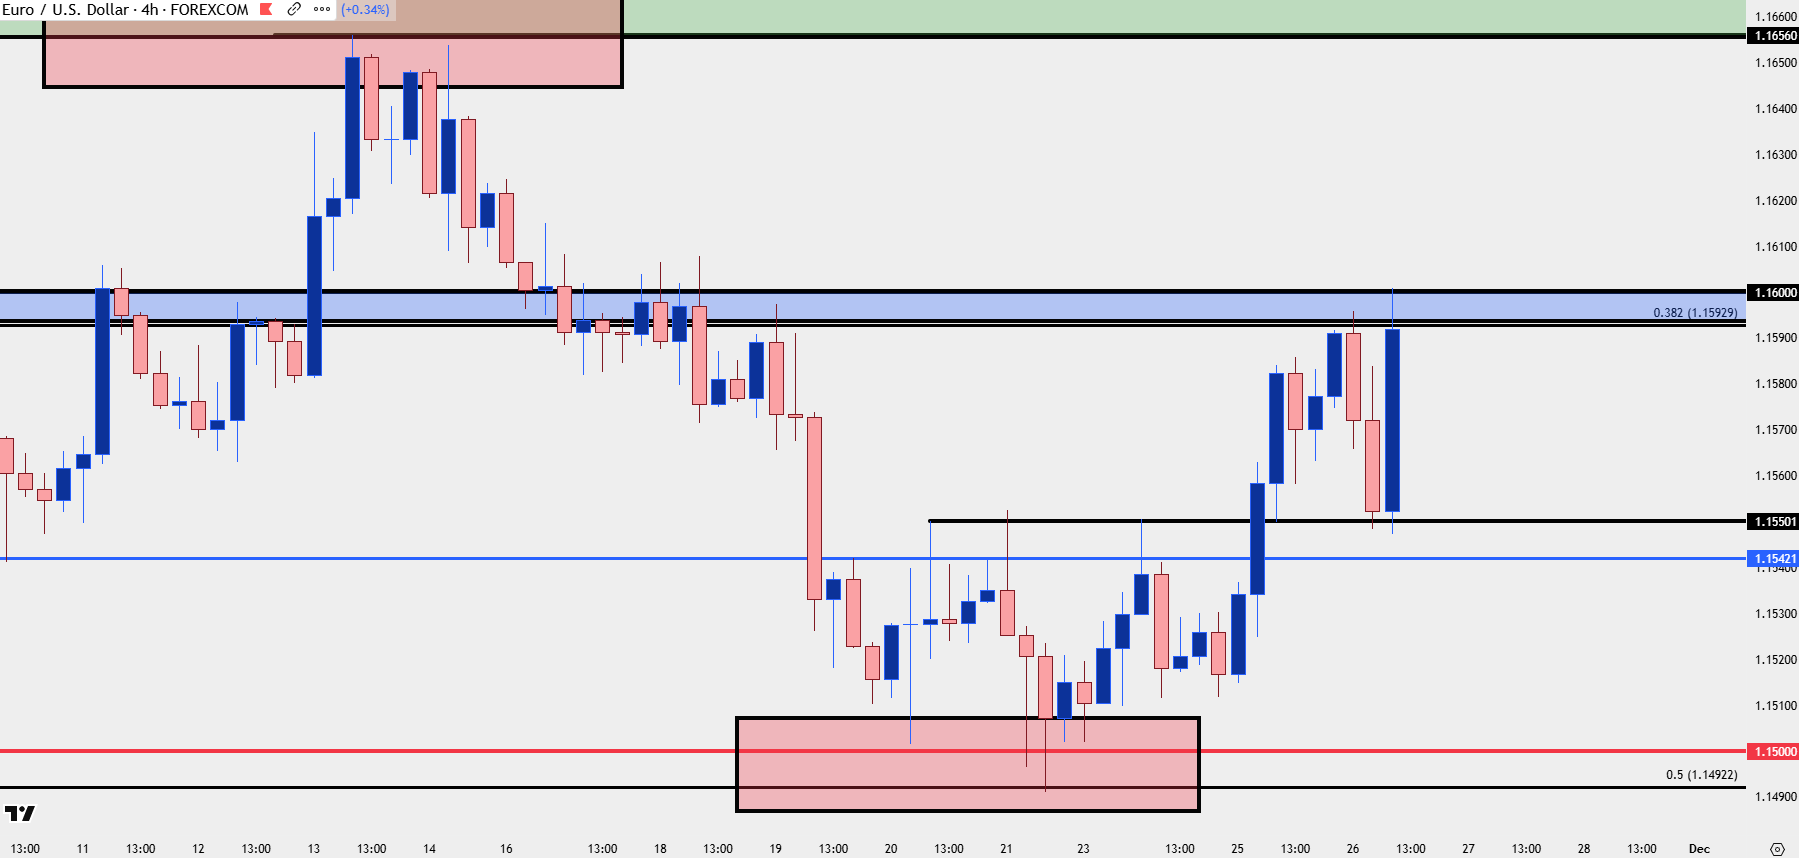
Chart prepared by James Stanley; data derived from Tradingview
EUR/USD Timeframe Tug of War
From the daily, shorts can still be justified, as of this writing as we have a hold of that 1.1593 resistance, and that’s inside of the prior lower-high zone from 1.1656-1.1669.
But from the four-hour, that becomes a bit more difficult as the higher-low at 1.1550 shows bullish continuation potential, so buyers would likely want to proceed by either waiting for a breakout and then support test at 1.1593-1.1600, or, looking for a pullback with a higher-low above the 1.1550 level that could then be justified for a higher-low.
From the two-hour chart, however, we can see a short-term reaction at that 1.1593 zone. So, from this time frame, bearish reversals could be more justified if we do see a hold in this zone of resistance, and that would align with the view from the daily.
Of interest here would be that 1.1550 level and whether sellers can push below on this round, which would then negate the bullish structure shown on the four-hour.
EUR/USD Two-Hour Chart
Chart prepared by James Stanley; data derived from Tradingview
--- written by James Stanley, Senior Market Analyst, Global Macro
Related tags:
Latest market news



Open an account in minutes
Experience award-winning platforms with fast and secure execution, and enjoy tight spreads from 0.5 pts on FX and 0.3 pts on indices.
Economic calendar
Web Trader platform
Our sophisticated web-based platform is packed with features.
Related articles
EUR/USD weekly outlook: Oil, inflation and NFP in focus
After coming under significant pressure in recent weeks, the EUR/USD came off its lows to finish the week on a positive note on Friday, albeit with only a mild rebound. That was not enough to prevent the exchange rate falling for the third consecutive week, as the US dollar and bond yields rallied across the board.

Gold Price Forecast: XAU/USD Avoids Breakdown as Yields Surged but Can it Continue?
Surging Treasury yields sent a jolt across markets last week but, so far, gold prices have held above the FOMC low. The big question now is whether that can continue and, if not, will bulls show up at $4100 or $4k like they did in June and July?

EUR/USD Q4 2026 Outlook: Euro at a Crossroads as Fed, ECB Tighten 9 25 2026
EUR/USD enters Q4 at a pivotal inflection point as competing Fed-ECB policy paths and persistent inflation risks collide with major technical support.
This report is intended for general circulation only. It should not be construed as a recommendation, or an offer (or solicitation of an offer) to buy or sell any financial products. The information provided does not take into account your specific investment objectives, financial situation or particular needs. Before you act on any recommendation that may be contained in this report, independent advice ought to be sought from a financial adviser regarding the suitability of the investment product, taking into account your specific investment objectives, financial situation or particular needs.
StoneX Financial Pte. Ltd., may distribute reports produced by its respective foreign entities or affiliates within the StoneX group of companies or third parties pursuant to an arrangement under Regulation 32C of the Financial Advisers Regulations. Where the report is distributed to a person in Singapore who is not an accredited investor, expert investor or an institutional investor (as defined in the Securities Futures Act), StoneX Financial Pte. Ltd. accepts legal responsibility to such persons for the contents of the report only to the extent required by law. Singapore recipients should contact StoneX Financial Pte. Ltd. at 6826 9988 for matters arising from, or in connection with the report.
In the case of all other recipients of this report, to the extent permitted by applicable laws and regulations neither StoneX Financial Pte. Ltd. nor its associated companies will be responsible or liable for any loss or damage incurred arising out of, or in connection with, any use of the information contained in this report and all such liability is hereby expressly disclaimed. No representation or warranty is made, express or implied, that the content of this report is complete or accurate.
StoneX Financial Pte. Ltd. is not under any obligation to update this report.
Trading CFDs carries a high level of risk that may not be suitable for some investors. Consider your investment objectives, level of experience, financial resources, risk appetite and other relevant circumstances carefully. The possibility exists that you could lose some or all of your investments, including your initial deposits. If in doubt, please seek independent expert advice. Visit www.forex.com/en-sg/terms-and-policies for the complete Risk Disclosure Statement.