
The US Dollar has pulled back as the key resistance zone has held yet again. The last major inflection there from earlier in November led to a higher-low, with support showing at the Fibonacci level of 98.98. And the question now is whether another higher-low shows after buyers grinded into that level for five consecutive days before finally yielding to pullback. Key for that theme is the largest component of DXY in the Euro, as the EUR/USD pair has continued to rally from yesterday’s test of the 1.1500 psychological level. GBP/USD may be a touch more attractive for USD weakness, whereas both USD/JPY and USD/CAD remain attractive for USD-strength scenarios.
US Dollar
The USD remains in a bullish setup on the daily chart but the resistance zone as taken from prior support has continued to hold, with a fifth consecutive day. It was the same 100.22 level that set support in Q3 of last year that came back into the picture earlier this month, building an evening star pattern on the daily before a pullback in DXY showed.
That pullback ran cleanly – until support played at a key Fibonacci level of 98.98 to set the low two weeks ago. The rally from that has, once again, run into a brick wall at that resistance from prior support, and now we have another pullback to work with.
At the time of the webinar we had already seen a test begin of the 99.72 support level, and a little lower is a zone of support potential from 99.33-99.56.
If those two areas give way, then we’re set up for another re-test of the 98.98 Fibonacci level and the key there will be whether buyers can hold a higher-low, or if they allow for what couldn’t happen two weeks ago with sellers pushing into a lower-low.
US Dollar Daily Chart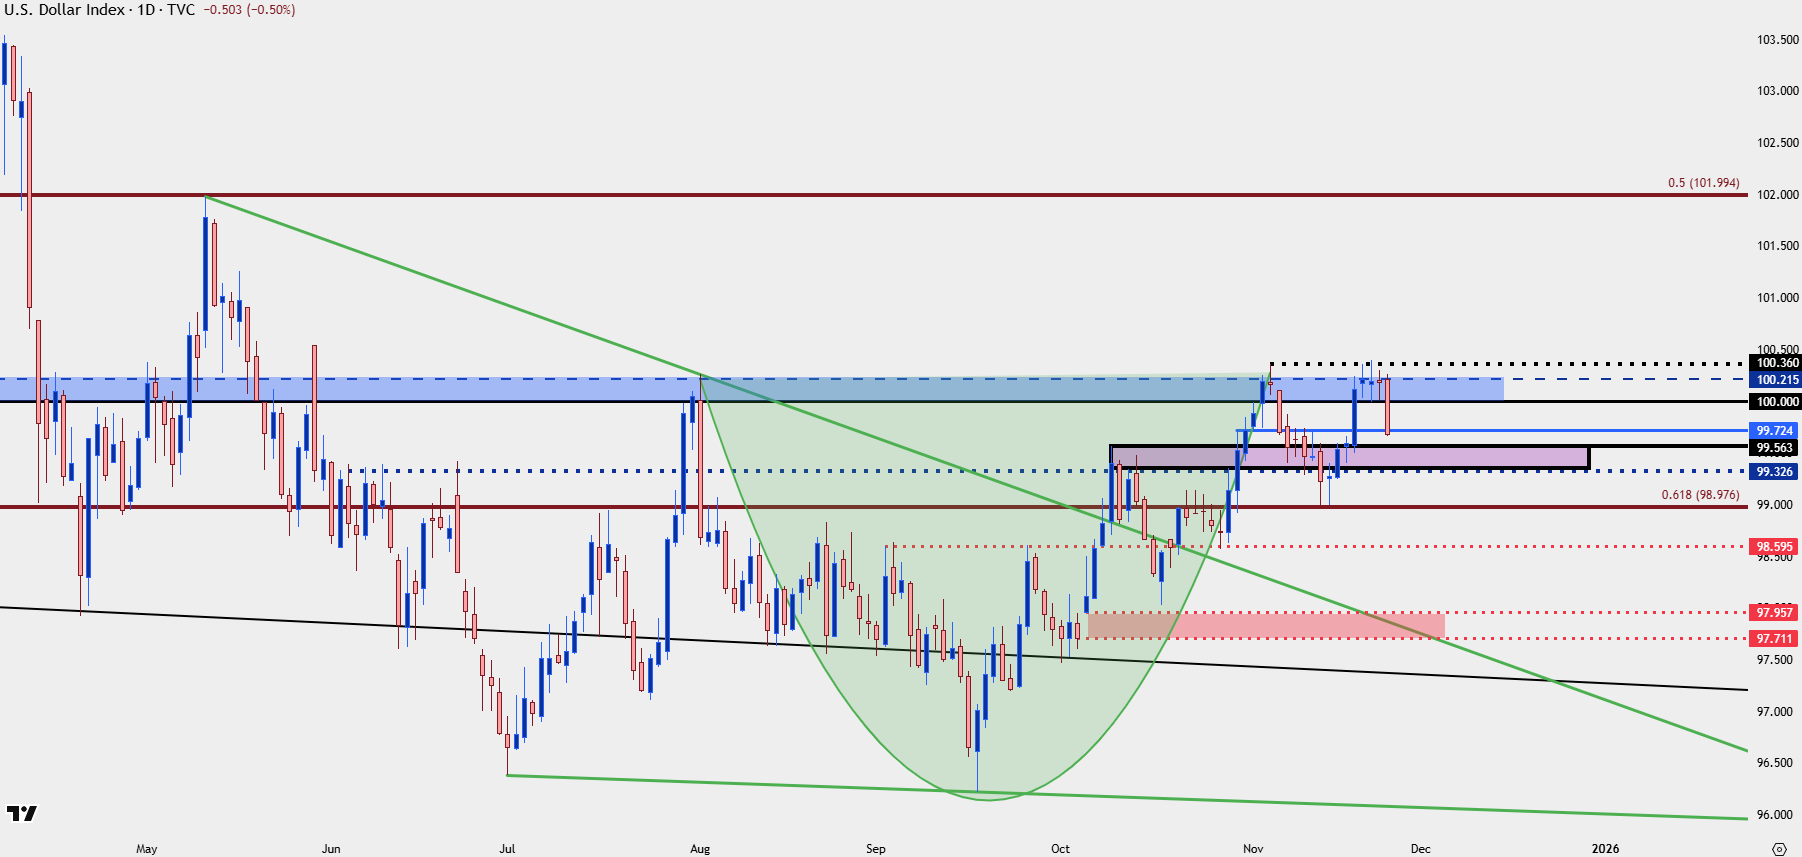
Chart prepared by James Stanley; data derived from Tradingview
EUR/USD Holds the Key for USD Trends
I’ve been saying for a while now that EUR/USD was the key component behind USD rally situations. And when the USD first began re-test of the 100.22 level in early-November, it was EUR/USD that I pointed to in these webinars as a cautionary detail, as the pair was testing below a major psychological level that doesn’t often give way easily.
That 1.1500 test led to a snap back – but – sellers held a lower-high at 1.1656 and to this day bearish structure can be argued from the daily chart.
But it was the re-test of the 1.1500 handle last Friday and then the higher-low yesterday morning that has so far led into a bounce, and now, from shorter-terms, bulls can justify higher-lows.
This sets up for a test of 1.1593 which, ideally, is what sellers would hold as resistance as this is a key short-term Fibonacci level. But, even if they don’t, it’s the 1.1656-1.1669 zone that looms large, as these prices are the two lower-highs from the past month. If sellers show up, then USD-strength and the cup and handle formation on the Dollar remain viable. If they don’t, it’s going to start to look like greater failure in DXY and the door would open for bigger picture bullish continuation scenarios in EUR/USD.
But, if looking for USD-weakness, there may be a more attractive venue elsewhere…

EUR/USD Daily Chart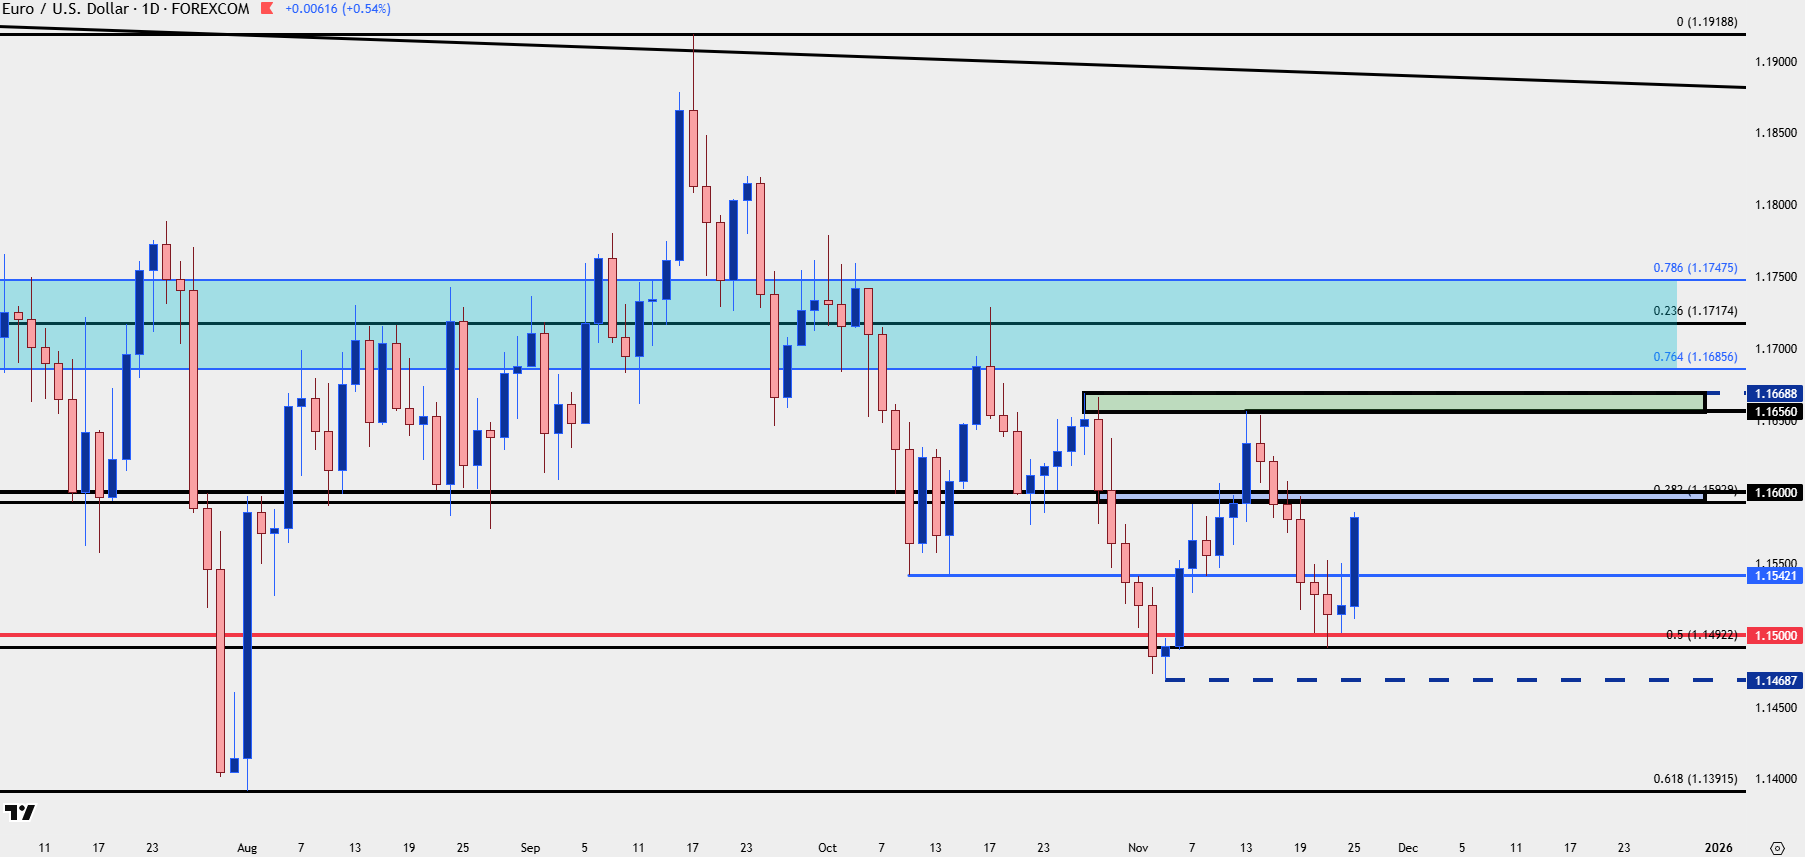
Chart prepared by James Stanley; data derived from Tradingview
GBP/USD
Earlier this month, when EUR/USD was testing below 1.1500 and DXY was testing resistance at 100.22, GBP/USD was not in a healthy spot. The pair had pulled up just shy of the 1.3000 level and RSI on the daily chart was at its most oversold since 2023. That led to a fast snapback move and as looked at in the two webinars after, the pair was starting to look more attractive for bullish scenarios.
I looked at this again in the video last Friday, honing in on a key zone from 1.3100-1.3117, and bulls have since pushed up to break a bearish trendline and the pair still retains an attractive backdrop for USD-weakness scenarios.
GBP/USD Four-Hour Chart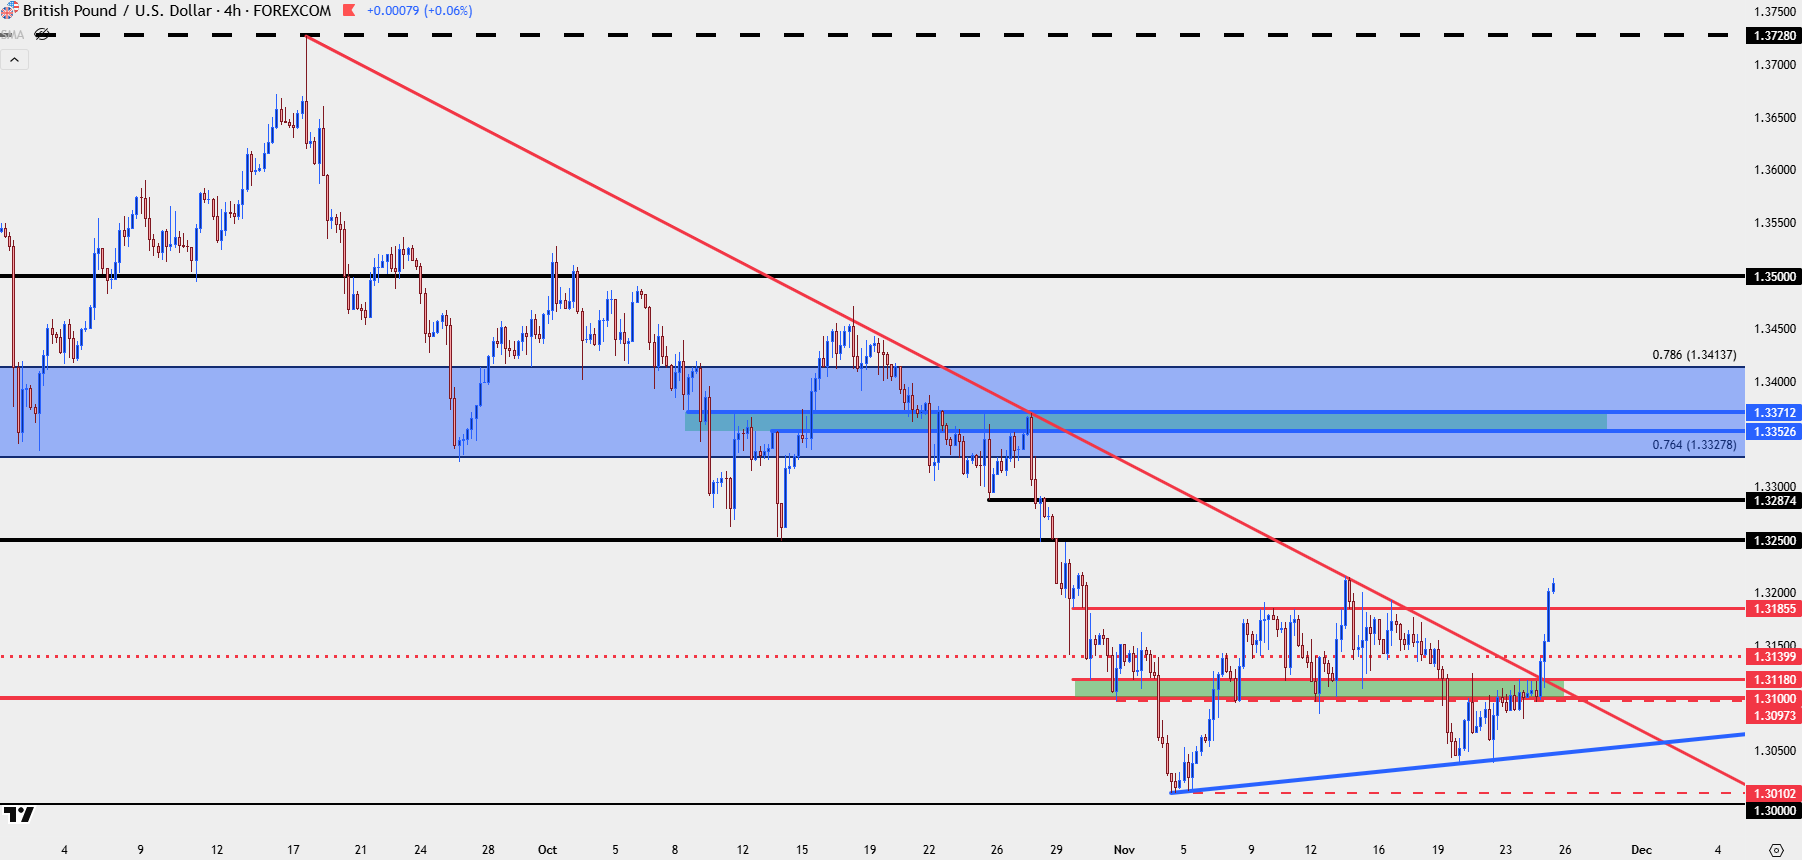
Chart prepared by James Stanley; data derived from Tradingview
USD/JPY
USD/JPY remains my favored pair for USD-strength scenarios and the current pullback may not be the worse factor for bigger picture trends. A continued one-sided move could elicit the ire of the Japanese Finance Ministry while the current pullback sets up for higher-low supports. From the daily, it’s the 154.45-155.00 area that looms large, and as shown in the webinar, there’s shorter-term levels that can be of interest, as well.
USD/JPY Daily Chart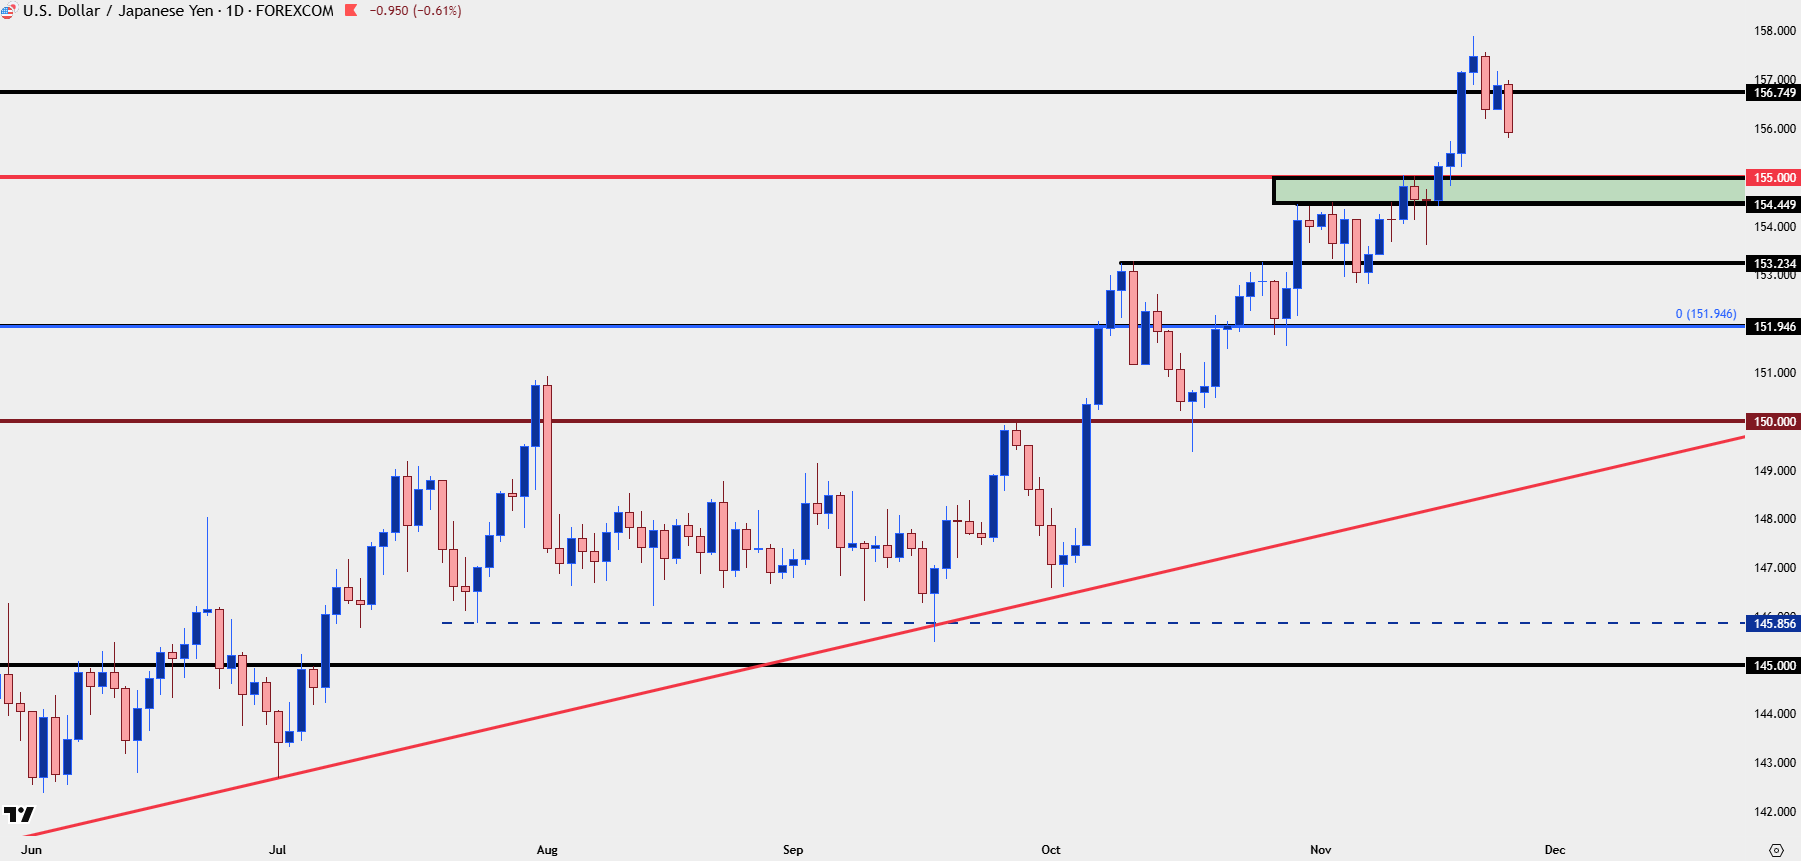
Chart prepared by James Stanley; data derived from Tradingview
USD/CAD
USD/CAD similarly retains attractive structure for USD-strength scenarios. The pair has been a bit quieter than USD/JPY, however, and that should be taken into account. Last week there was an open door for sellers to take a shot with the pair pushing below the 1.4000 handle. But they quickly drew back, allowing for a strong rally back above the big figure but like we saw a few weeks ago, buyers seem unwilling to test longer-term resistance at the 1.4151-1.4178 zone.
There’s now support potential at 1.4068 and then 1.4034, with 1.4019 of interest, as well; although it’s really about the 1.4000 handle. The sooner buyers show up the more motivation that they’ll show, and that will then have some sway on topside potential and whether there’s breakout potential beyond the 1.4150 area.
USD/CAD Four-Hour Chart
Chart prepared by James Stanley; data derived from Tradingview
--- written by James Stanley, Senior Market Analyst, Global Macro