
It was a week of strength for the US Dollar following last Friday’s hold at key support of 98.98 in DXY. For three days this week the Dollar has edged higher while at a massive spot of resistance while tempting a larger breakout. One of the large factors at this point remains EUR/USD testing a major psychological level at the 1.1500 handle, but USD/JPY trends remain meaningful as the pair gets closer and closer to levels that could elicit intervention threats from the Japanese Finance Ministry.
Well, we’re now at the stage where accusations of carry unwind have started to flow through equities markets. Paradoxically, it seemed many of those pointed fingers started to show as USD/JPY was going up, with Yen-weakness remaining as a dominant theme across FX markets.
To be sure, I do think there is a large carry trade remaining in the pair and I do think it could wreak havoc on equities at some point. But given trajectory of USD/JPY my larger question there is one of timing and whether that’s a risk that the Finance Ministry wants to take given the reaction to their ill-timed intervention last July, which spurred a massive case of global de-leveraging with many alleging the source of the problem to the unwind of the trade that the Bank of Japan had spent the prior few years building.
The mechanics behind it are fairly simple, and that’s relevant for this article as it can have an outsized impact on the US Dollar, just as we saw last year. While the Japanese Yen is a mere 13.6% of the DXY quote, ultra low rates in Japan can attract significant interest from US market participants, with hedge funds taking out loans at rates far lower than can be found in the States. That capital can then be invested elsewhere, and initially bonds are the attractive venue as there’s a spread to be had with relatively low risk. But, as buying pushes yields lower, that spread tightens and the focus goes elsewhere – to riskier pockets of the economy.
For American hedge funds taking out loans in Japan to invest in higher-yielding assets and economies, there’s but one problem, and that’s the fact that the loans are in Yen. And if the Yen is dropping quickly given that rate disparity, well, there’s a need to hedge that risk, and selling JPY to offset that exposure and buying another currency, like the US Dollar, can accomplish that aim. But when those trades close or when there’s the prospect of taking a loss in the hedge, the trend can start to go the other way very, very quickly, as we’ve seen in the recent past.
Last year the Finance Ministry ordered intervention in April, following the first break of the 160.00 handle in USD/JPY. That failed, as weakness in the pair lasted for about a week, with buyers loading up at a test of support at prior resistance.
And then in July, with USD/JPY back above the 160 handle, the Finance Ministry again ordered an intervention and this time, it was on the morning of one of the largest US drivers at the time with the release of the CPI report. That was like a one-two punch on the morning of July 11th as a weak CPI print coupled with the BoJ intervention led to a spiraling effect that reversed the bullish trend so hard that selling was triggered in high-flying venues like tech stocks.

USD/JPY Weekly Chart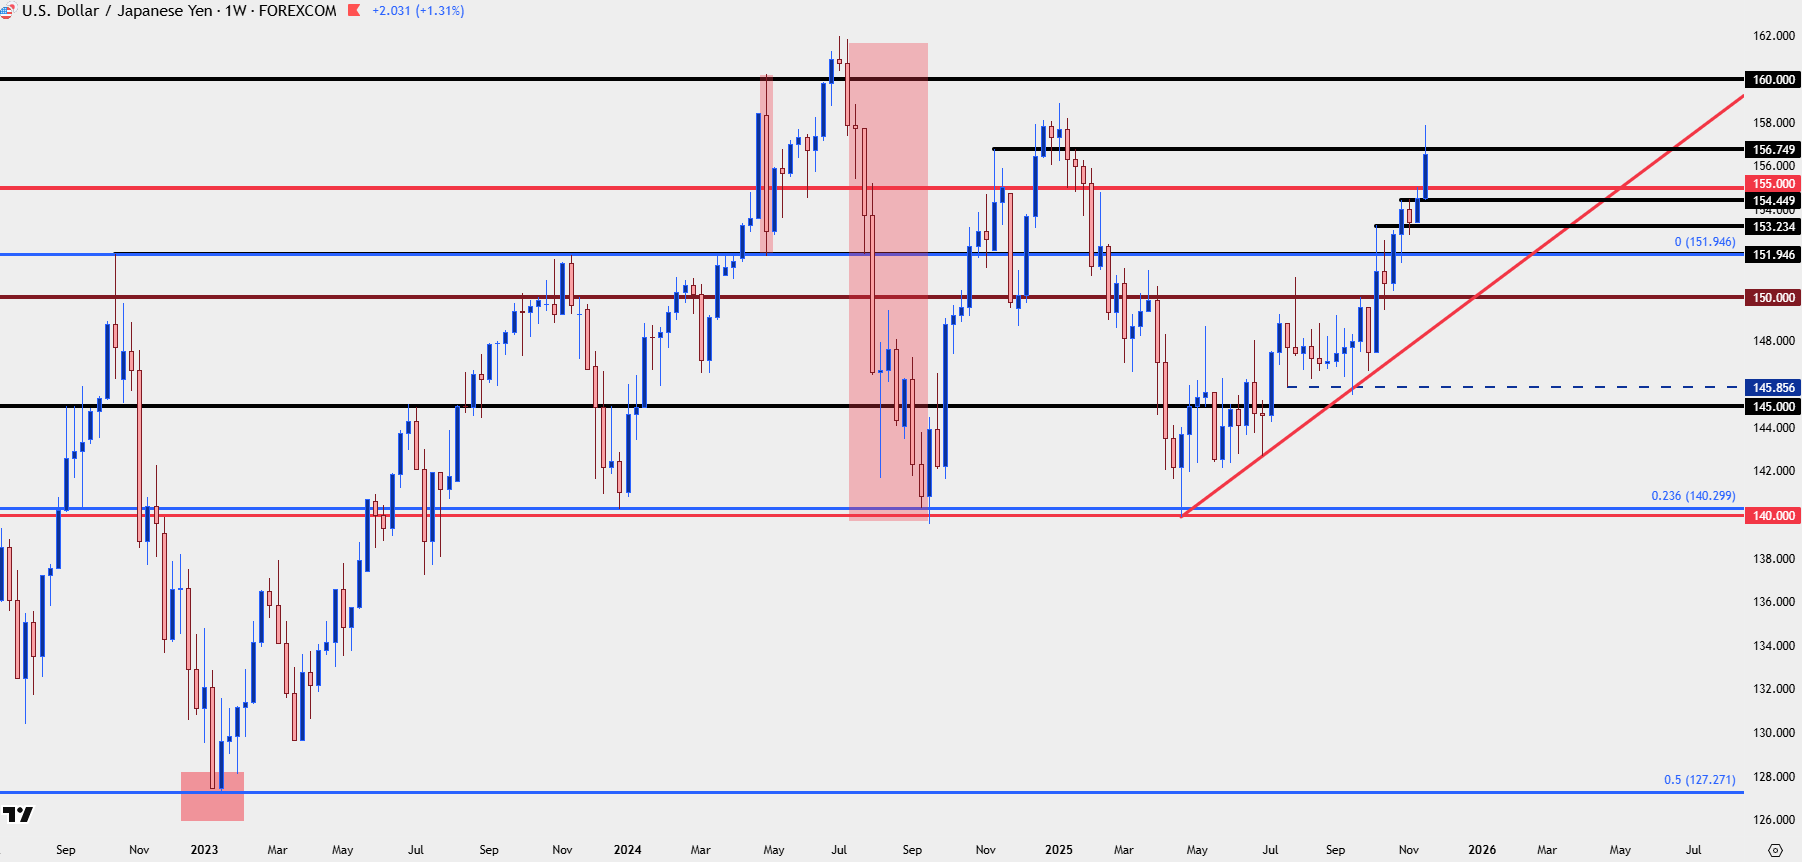
Chart prepared by James Stanley; data derived from Tradingview
It didn’t take long, but by early-August the VIX index had risen to its third-highest reading ever, and the spark point for the whole ordeal was unwind of the carry trade that had been driving leverage into global markets for much of the prior couple years. It took some time, but the BoJ was able to soothe concerns and USD/JPY held support at 140 in September, eventually leading to another rally as attention shifted to other matters and away from the prospect of carry unwind and global de-leveraging.
But now, we’re at the other end of the saga as the recent election of Sanae Takaichi and her pro-growth policies have triggered an Abe-like run of Japanese Yen weakness.
I’ve been harping on USD/JPY as one of the most attractive venues for USD-strength and even with DXY setting fresh lows on July 1st and then September 17th, USD/JPY has continued with higher-lows; and more recently, higher-highs as prices have continued to breakout. We’re still in the early stages of the matter as we’ve only heard what seem like initial threats from the Finance Ministry, and at this stage, USD/JPY remains in a near-parabolic like state.
Chasing such moves is difficult, but if we do hear another intervention threat, that could be a reason for pullback which bulls can look at opportunistically. The 155.00 psychological level remains a huge spot, and that can be synced down to prior support of 154.45 for a support zone, with another just below at 153.23.
USD/JPY Daily Chart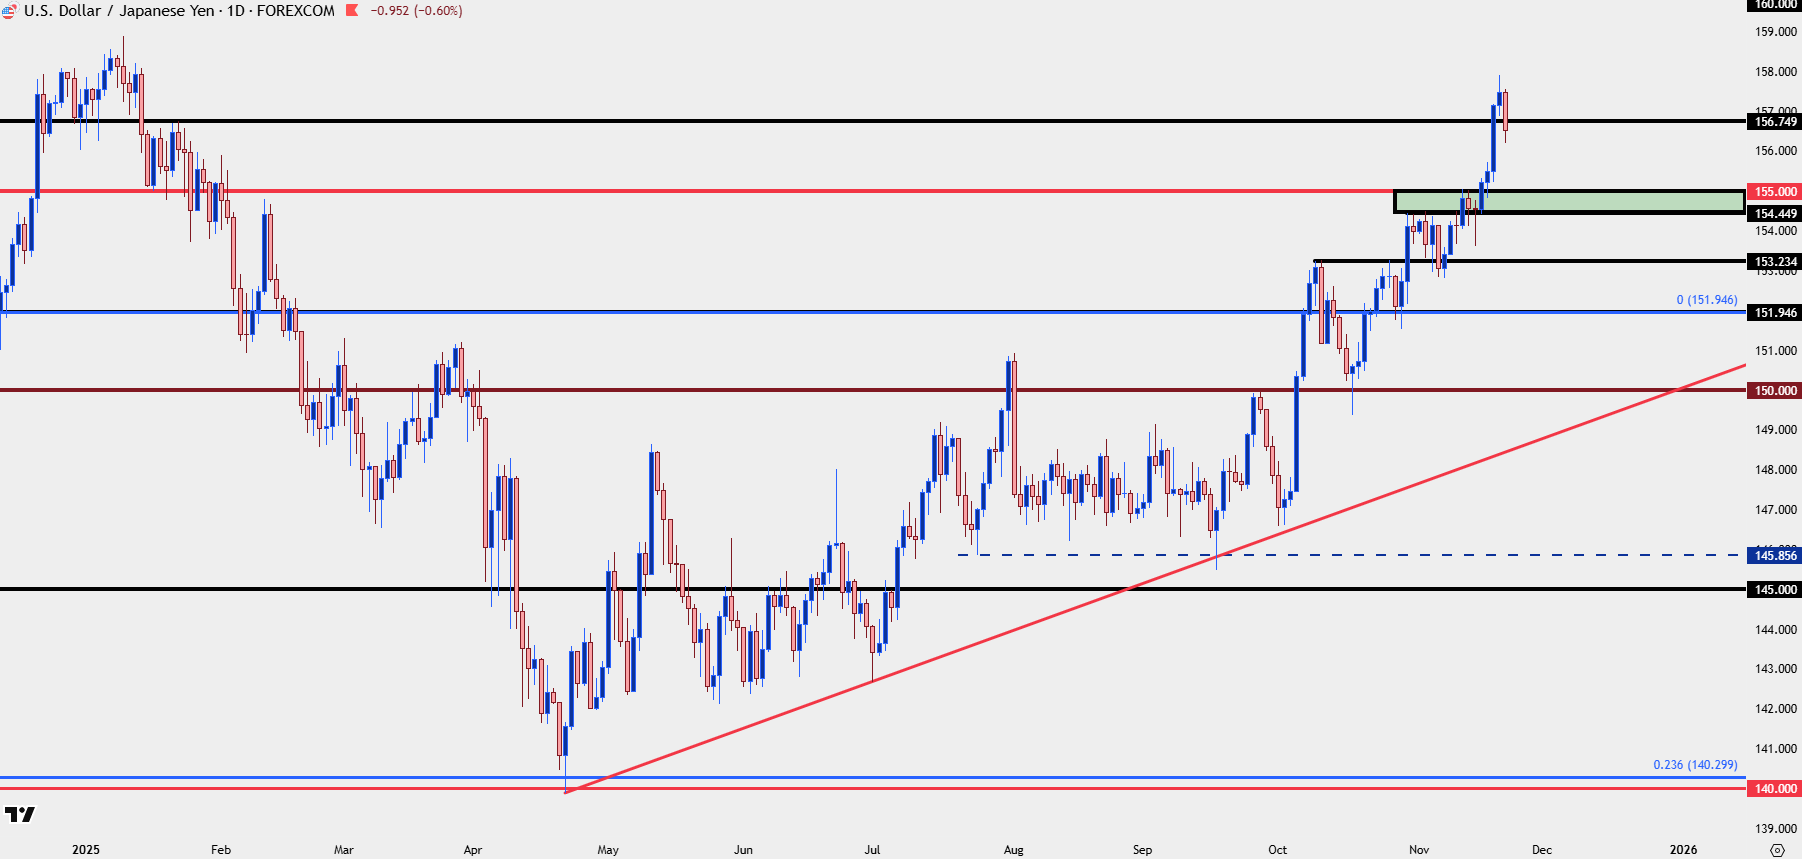
Chart prepared by James Stanley; data derived from Tradingview
USD
The US Dollar remains in a bullish state as well with the currency continuing to test a massive spot of resistance that I’ve been talking about for months at 100-100.22. This was support last year ahead of the Q4 rally, and it became resistance in August just before the USD reversed around the NFP release on the first of the month.
The 98.98 level remains key as this is the 61.8% Fibonacci retracement of the 2021-2022 major move, and this is the level I’ve been calling my ‘s2’ support for weeks. That held the lows perfectly last week and led into a bounce and re-test of resistance this week.
At this point from the daily, there’s a bullish formation with a cup and handle showing as we move into next week.
Interestingly, this backdrop has built even with EUR/USD remaining somewhat restrained while holding a major psychological level at 1.1500, and if that gives way, we could be soon looking at breakout in both DXY and EUR/USD.
US Dollar Daily Chart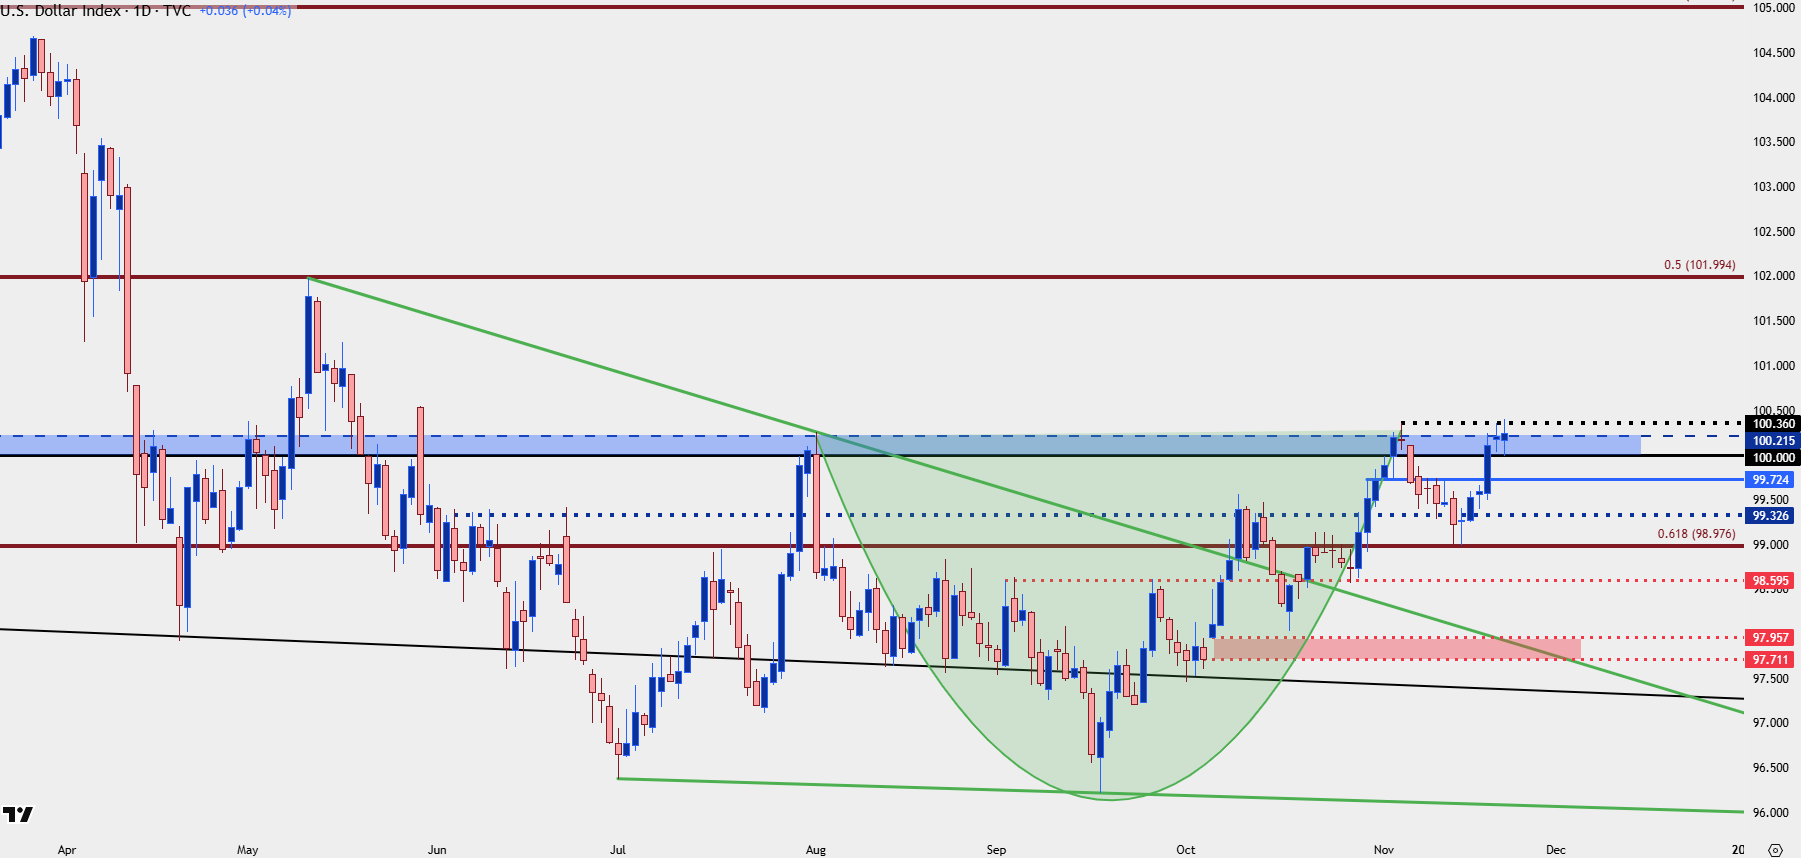
Chart prepared by James Stanley; data derived from Tradingview
EUR/USD
The Euro is 57.6% of the DXY quote so oftentimes if there’s a trend in one, there’s drive from the other. There can be exceptions, however, such as we saw in Q3 of last year when it seemed to be more of a Yen-strength movement driving USD-weakness, which helped to buoy EUR/USD up to the 1.1200 handle.
But more recently EUR/USD has been clinging to the 1.1500 level and while that price has already bent a couple of times, it hasn’t yet broken on a daily close basis.
I talked about that price a couple of times this week while highlighting its long-term impact. It’s not a level that usually gives way easily as a psychological level of that nature can be important for many non-speculators in the market: Think central banks or Treasury departments at multi-national corporations, where they’re not focused on short-term momentum and, instead, are looking to meet payroll obligations and that first test below 1.1500 can make the Euro seem cheap and the USD expensive, thereby bringing on a response (and related price movement).
That helps to explain the two-plus year range back in 2015-2017 and more recently, the resistance hit in April that brought four weeks of pullback or the support test in August that created a slingshot-like move in EUR/USD.
My approach here is generally to remain cautious of chasing breaks and, instead, looking to fade rallies pullbacks while focusing on lower-high resistance structure from the daily chart. I looked into that on Thursday and since then there was a intra-day resistance test at 1.1542 on Friday but the prior lower-high at 1.1656 afford some room, for a pullback around the 1.1593-1.1600 area or perhaps re-test of that same 1.1542 level.
EUR/USD Daily Chart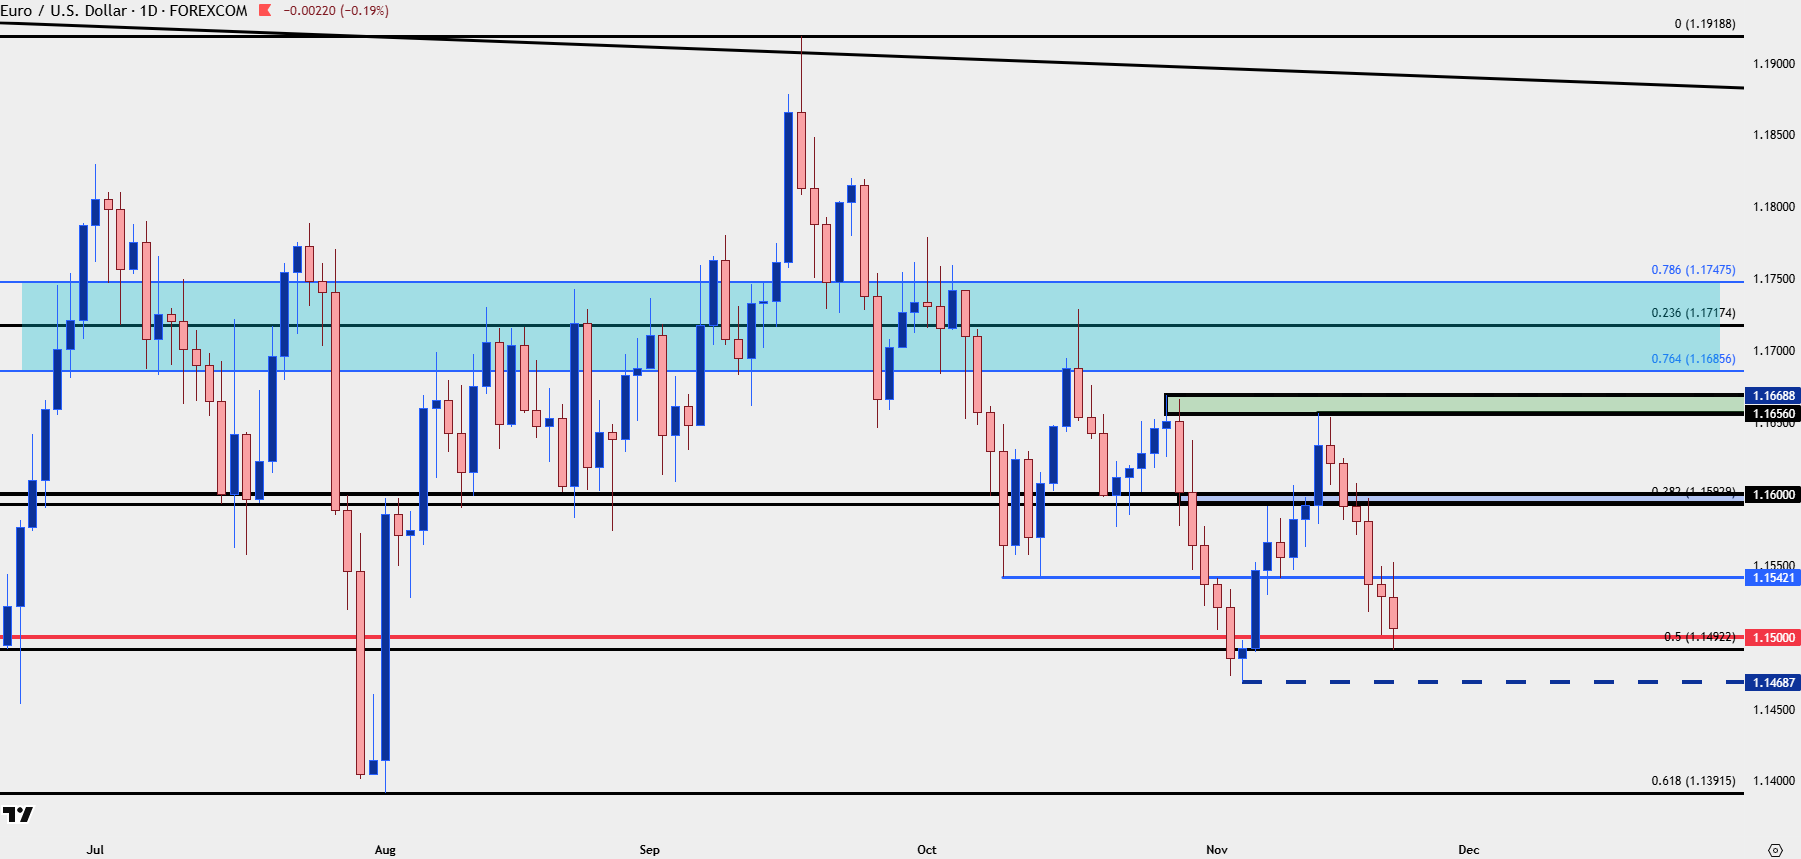
Chart prepared by James Stanley; data derived from Tradingview
--- written by James Stanley, Senior Market Analyst, Global Macro