
Australian Technical Forecast: AUD/USD Weekly Trade Levels
- AUD/USD fell for a fourth consecutive session on Friday, extending its weekly losing streak to three as weekly momentum dropped to its lowest level since April 2025.
- The break below the broader consolidation has shifted the technical outlook lower, with sellers now approaching a major support confluence.
- A decisive weekly close below this threshold would strengthen the bearish outlook and expose further downside objectives.
- Former support now defines initial resistance, with a sustained recovery above the September downtrend needed to suggest a more significant low is developing.
- Next week's RBA minutes and Australian employment report headline event risk, alongside U.S. retail sales and FOMC minutes.
- Resistance 6890/94, 6938/46 (key), 7032 - Support 6724/57 (key), 6674, 6596
The Australian Dollar enters mid-November under mounting selling pressure after the October recovery failed to gain traction, leaving AUD/USD increasingly vulnerable to a deeper correction. The latest decline has extended more than 6.4% off the September high and materially weakened the medium-term technical structure. Sellers are now approaching a significant support confluence where the immediate move lower could encounter renewed opposition. While the broader outlook continues to favor the bears, the proximity of this threshold raises the prospect of a near-term exhaustion low and potential recovery attempt. The next reaction will be particularly important in determining whether the recent technical deterioration develops into a more sustained decline toward year-end. Battle lines drawn on the AUD/USD weekly technical chart.
Review my latest Weekly Strategy Webinar for an in-depth breakdown of this AUD/USD technical setup and more. Join me live Mondays at 8:30am EST and tune in to the Opening Bell Tuesday through Friday at 9:30am EST for continued market coverage throughout the week. All episodes are archived on my YouTube Playlist.
Australian Dollar Price Chart – AUD/USD Weekly
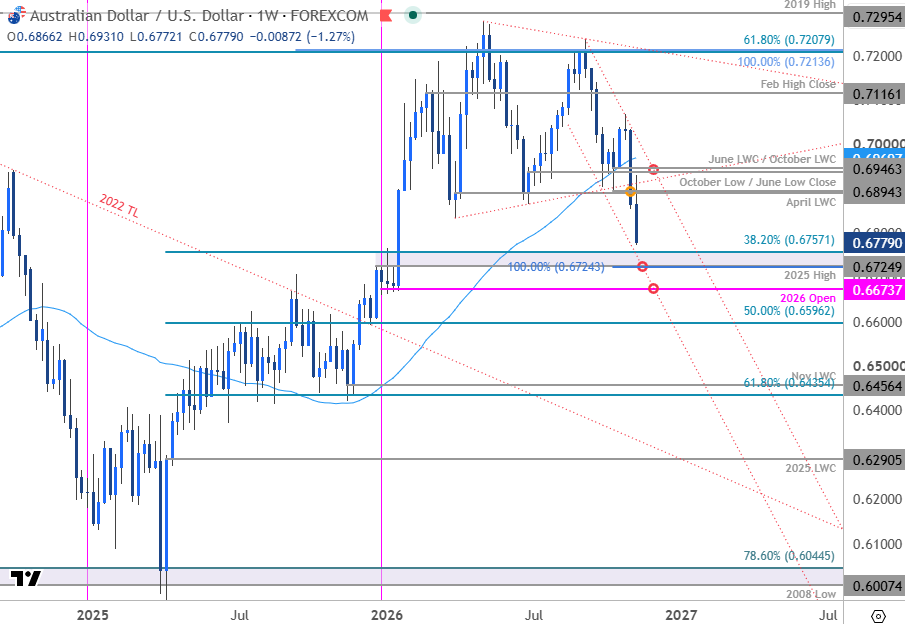
Chart Prepared by Michael Boutros, Sr. Technical Strategist; AUD/USD on TradingView
Technical Outlook: In last month’s Australian Dollar Forecast we noted that, AUD/USD had “rebounded off confluent support near the lower bounds of a multi-month consolidation pattern. From a trading standpoint, losses would need to be limited to 6938 IF price is heading higher on this stretch with a close above 7025 needed to keep the immediate recovery viable heading into the close of the month.” The recovery extended more than 2.5% off the October low and despite registering a close high at 7034, the bulls were unable to sustain the advance with the subsequent reversal posting a third consecutive weekly decline. Weekly RSI has now fallen to the lowest level since April 2025 and keeps the momentum profile in favor of the bears for now.
A decline of more than 4.1% from the October high has now broken below a multi-month consolidation structure with the bears now approaching a major technical confluence at 6725/57. This region is defined by the 100% extension of the September decline, the 2025 swing high, and the 38.2% retracement of the 2025 advance. Channel support converges on this threshold over the next few weeks. A break / weekly close below this pivot zone would be needed to fuel the next leg lower with subsequent support objectives seen at the 2026 yearly open at 6674 and the 50% retracement at 6596.
Weekly resistance is now eyed back at 6890/94- a region defined by the April low-week close, the October low, and the June low close. Key resistance / bearish invalidation is now lowered to the June / October low-week closes (LWC) at 6938/46. Note that the September trendline converges on this level into the open of December and a breach / weekly close above would be needed to suggest a more significant low is in place, and a larger reversal is underway. Subsequent resistance objectives eyed at the 200-day moving average (currently ~6970) and the October high-week close at 7032.

Bottom line: AUD/USD has broken a multi-month consolidation pattern with price falling to the lowest level since late-January. From a trading standpoint, rallies would need to be limited to 6894 IF price is heading lower on this stretch – look for a larger reaction on a test of the 6725/57 support zone with a weekly close below needed to fuel the next major leg of the decline.
AUD/USD event risk next week will center on the RBA minutes Tuesday and Australia’s October employment report Thursday. The minutes will offer further insight into the RBA’s recent 25-basis-point hike and the removal of its explicit tightening bias, while the labor data will test whether the Bank can justify keeping policy restrictive as the pair trades near a 10-month low. Strong employment data could challenge expectations that the November hike marked the end of the tightening cycle and help AUD/USD stabilize. U.S. retail sales and the FOMC minutes add dollar-side risk, with firm U.S. activity or a hawkish Fed read likely to keep pressure on the pair. Stay nimble into the releases and watch the weekly closes for guidance. Review my latest Australian Dollar Short-term Outlook for a closer look at the near-term AUD/USD technical trade levels.
Australia / US Economic Calendar
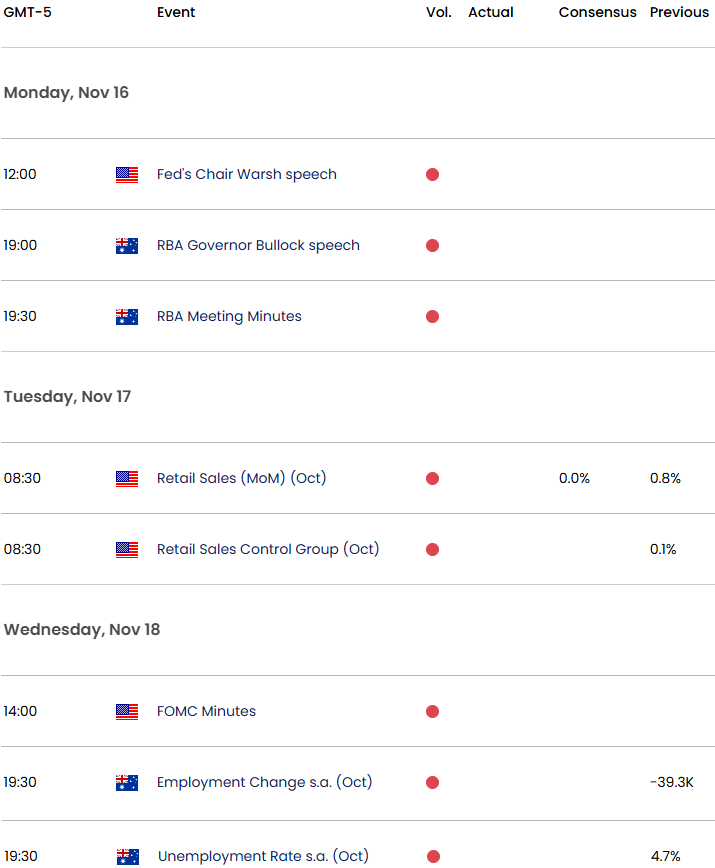
Economic Calendar - latest economic developments and upcoming event risk.
Active Weekly Technical Charts
- Swiss Franc (USD/CHF)
- British Pound (GBP/USD)
- US Dollar Index (DXY)
- Euro (EUR/USD)
- Gold (XAU/USD)
- Bitcoin (BTC/USD)
- Canadian Dollar (USD/CAD)
- Japanese Yen (USD/JPY)
- S&P 500, Nasdaq, Dow
--- Written by Michael Boutros, Senior Technical Strategist
Follow Michael on X @MBForex