




EUR/USD, EUR/GBP analysis: European open – 31/08/2023
With the US dollar having fallen for three days ahead of today's PCE inflation report, we're going to need to see some soft numbers for the US dollar to move materially lower from here. So could that could leave an upside surprise and subsequent rally for the US dollar if inflation is hotter than liked? Either way, 1.0900 is likely to be pivotal level for EUR/USD today, and a host of European data points also puts EUR/GBP into focus ahead of the inflation report.
Share this:

- China’s official PMIs were mixed with manufacturing contracting at a slower pace whilst services expanded at a slower pace. Whilst this saw the composite tick higher to 51.3 (above 50 is expansion), it’s certainly nothing to get excited about.
- Business investment in Australia (capex) saw its best quarter since 2015 at 2.8% (2.4% in Q1) as tax cuts enticed spending on equipment. Firms also increased spending plans for fiscal year 2024, which rose 14.5% q/q
- As AUD/USD was already enjoying a strong start to the session, the data coincided with the high of the day before mixed PMIs from China saw the Aussie hand back earlier gains
- Gold is trying to notch up its fourth consecutive day higher, although it should be noted that Wednesday’s bullish candle was less than half the size of Tuesday’s (and half of that its range was upper wick), which shows a loss of bullish momentum over the near term
- WTI crude oil is trading in a narrow range just beneath Wednesday’s high, but like many other markets now sits in the hands of today’s UC PCE inflation report and the performance of US yields and the dollar
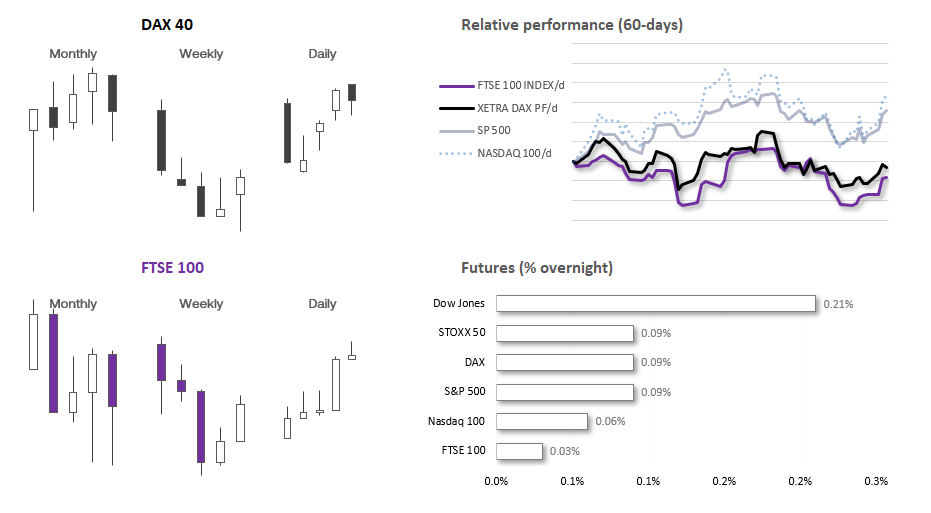
- DAX formed a 2-bar bearish reversal pattern yesterday (dark cloud cover) to warn of a potential pullback. But as mentioned in yesterday’s report, low volatility pullbacks that hold above 15,600 could be favourable to bulls
- Stock market index futures are modestly higher ahead of today’s US inflation report
Events in focus (GMT+1):
- 07:45 – France CPI (revised)
- 08:15 - BOE member Pill speaks: “Back to target? Monetary policy in advanced economies”
- 08:55 – Germany unemployment
- 10:00 - Eurozone CPI (revised)
- 13:30 – US PCE inflation, jobless claims
With Fed Fund futures betting with ~90% conviction that the Fed will hold interest rates steady in September, and renewed optimism that they have reached their terminal rate, markets may want to see softer PCE inflation and rising jobless claims to feel safe that their bearish reaction to weak job openings was correct. Yet estimates suggest the PCE index could rise to 3.3% y/y (3.0% previously) and core PCE rise to 4.2% y/y (4.1% previously). Whilst both PCE and core PCE are expected to hold steady at 0.2% m/m, what if they rise? It could certainly put a fly in bearish ointment and makes the bearish bets on the US dollar this week question their positioning. Therefore, we’ll keep a close eye on the direction of the monthly reads as they may provide the better cue for which way the US dollar trades, heading into Friday’s Nonfarm payroll report (NFP).
Whilst trading ranges were relatively quiet during the Asian session outside of AUD/USD, 1-day implied volatility levels are 169% or higher relative to their 20-day averages for EUR/USD, GBP/USD, USD/CHF and USD/CAD.
EUR/USD technical analysis (1-hour chart):
EUR/USD has risen for three days – and the past 2 days has been the most bullish 2-day range in six weeks. And with so much excitement from weak US data, the contrarian in me wonders whether markets have once again gotten ahead of themselves and we’re due some mean reversion.
A pullback towards the daily pivot point / July open or even 1.0900 seems feasible ahead of US inflation data. And it may be a tempting level for dips buyers to re-enter in anticipation of softer US CPI figures. But by the same token, a break beneath this pivotal level could look equally tempted to bears.
EUR/GBP technical analysis (daily chart):
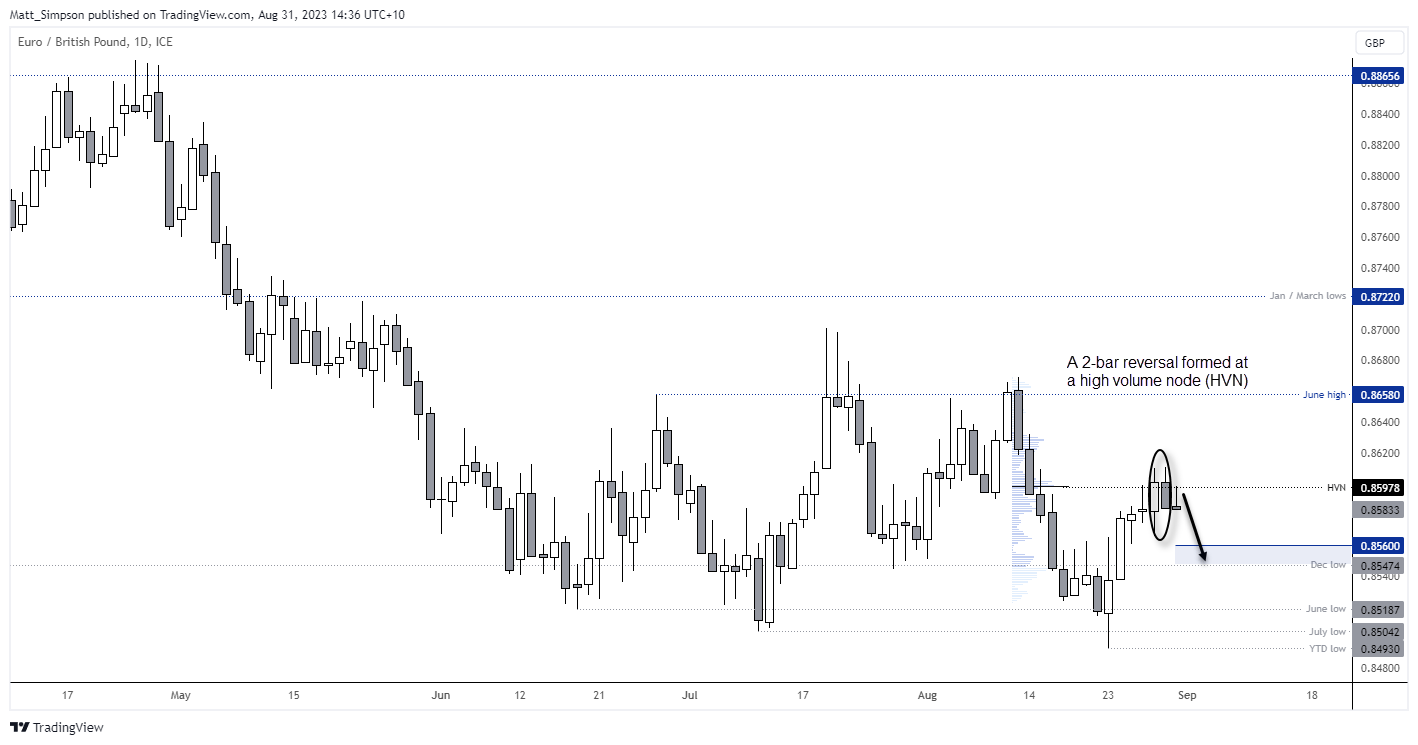
EUR/GBP has produced some decent swings over the past couple of months, even if it has essentially traded sideways. But to hammer home the point it really has gone sideways, I noted that the open to close range of the past three months has been just 30 pips.
The daily chart shows that a false break of the June and July low prompted a 1.4% rally in just four days (from the freshly printed YTD low). A 20-bar bearish reversal pattern called a dark cloud cover formed, and prices are now testing Wednesday’s low. Given the 2-bar reversal pattern formed around a high-volume node (HVN) from a prior decline, the bias is for another dip lower. As it is the end of the month, traders should be prepared for some fickle price action. But from a purely technical perspective, a move down to the December low / 0.8560 seems achievable.
View the full economic calendar
View the full economic calendar
-- Written by Matt Simpson
Follow Matt on Twitter @cLeverEdge
How to trade with City Index
You can trade with City Index by following these four easy steps:
- Open an account, or log in if you’re already a customer
• Open an account in the UK
• Open an account in Australia
• Open an account in Singapore
- Search for the market you want to trade in our award-winning platform
- Choose your position and size, and your stop and limit levels
- Place the trade
Related tags:
Latest market news




Open an account in minutes
Experience award-winning platforms with fast and secure execution, and enjoy tight spreads from 0.5 pts on FX and 0.3 pts on indices.
Economic calendar
Web Trader platform
Our sophisticated web-based platform is packed with features.
Related articles
US Core PCE Preview: Stale or Significant for the Fed
Core PCE inflation takes center stage Wednesday, with traders watching for signs of renewed price pressure and clues on whether the Fed could hike again in October.
Australian Dollar Forecast: AUD/USD Four-Week Slide Nears Critical Uptrend Support 9 29 2026
Aussie momentum has deteriorated sharply into quarter-end, with inflation, Core PCE and NFP on tap as AUD/USD closes in on a pivotal technical threshold.

Euro Forecast: EUR/USD Tumbles Towards Yearly Low as Daily RSI Goes Oversold
EUR/USD has been hit hard in the final month of the quarter as USD strength has shown up in a big way. With the pair set to challenge its yearly low as RSI has pushed into oversold territory, is there a chance for a pullback with some big headline risk hitting in the US over the next few days?

This report is intended for general circulation only. It should not be construed as a recommendation, or an offer (or solicitation of an offer) to buy or sell any financial products. The information provided does not take into account your specific investment objectives, financial situation or particular needs. Before you act on any recommendation that may be contained in this report, independent advice ought to be sought from a financial adviser regarding the suitability of the investment product, taking into account your specific investment objectives, financial situation or particular needs.
StoneX Financial Pte. Ltd., may distribute reports produced by its respective foreign entities or affiliates within the StoneX group of companies or third parties pursuant to an arrangement under Regulation 32C of the Financial Advisers Regulations. Where the report is distributed to a person in Singapore who is not an accredited investor, expert investor or an institutional investor (as defined in the Securities Futures Act), StoneX Financial Pte. Ltd. accepts legal responsibility to such persons for the contents of the report only to the extent required by law. Singapore recipients should contact StoneX Financial Pte. Ltd. at 6826 9988 for matters arising from, or in connection with the report.
In the case of all other recipients of this report, to the extent permitted by applicable laws and regulations neither StoneX Financial Pte. Ltd. nor its associated companies will be responsible or liable for any loss or damage incurred arising out of, or in connection with, any use of the information contained in this report and all such liability is hereby expressly disclaimed. No representation or warranty is made, express or implied, that the content of this report is complete or accurate.
StoneX Financial Pte. Ltd. is not under any obligation to update this report.
Trading CFDs carries a high level of risk that may not be suitable for some investors. Consider your investment objectives, level of experience, financial resources, risk appetite and other relevant circumstances carefully. The possibility exists that you could lose some or all of your investments, including your initial deposits. If in doubt, please seek independent expert advice. Visit www.forex.com/en-sg/terms-and-policies for the complete Risk Disclosure Statement.