



EUR/USD Forecast: Finding a floor as positioning unwind runs its course
As momentum trades unwind across markets, EUR/USD is holding up well, suggesting selling pressure may be fading. A near-term floor could be emerging.
Share this:
- EUR/USD showing signs of a near-term floor
- Markets looking through worst-case energy shock risk
- Risk sensitivity greatest in prior market outperformers
Energy shock not breaking EUR
Considering the precarious position Europe finds itself in relative to the United States, it’s notable EUR/USD continues to find support on dips in this environment, suggesting there’s a degree of preemption going on when it comes to the duration of the energy supply shock and the impact it may have on the world’s two largest economies.
What it points to is a market that may already be looking through the worst-case scenario. That doesn’t mean the risks of such an outcome aren’t real, but rather that the broad threat of widespread and long-lasting energy shortages may already largely priced, especially in markets where there wasn’t an extreme build-up in positioning heading into the shock. That view is reinforced by energy futures curves, which remain backwardated, with prices seen easing over time even if elevated relative to pre-war levels.
Despite threats from Donald Trump to “obliterate” Iran’s power plants within 48 hours, and a counter-threat from Iran to shut the Strait of Hormuz and target US-linked infrastructure across the region, the euro's price action has been resilient, hinting European FX names may be close to carving out, a bottom.
Pain concentrated in crowded trades
Granted, the risk of escalation hasn’t gone away, with headlines during the Asia session pointing to fresh Israeli strikes on Iranian infrastructure and reports of attacks on residential areas, further denting risk appetite.
But the market reaction has been instructive. The assets getting hit hardest are the ones that had run the most beforehand, whether it be gold and silver, equity markets like the Nikkei and KOSPI, or high beta FX such as the Aussie and Kiwi, which had outperformed earlier this year, suggesting the unwind is as much about positioning and momentum getting squeezed as it is the geopolitical environment itself.
Shift from energy to rate dynamics
Source: TradingView
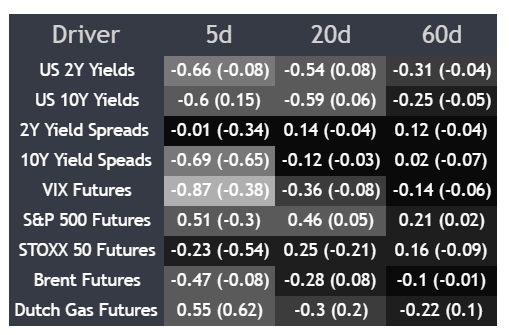
Against that backdrop, the correlation matrix for EUR/USD is providing a similar message. The pair has shown a positive relationship with Dutch gas futures over the past week, which is the opposite of what you’d expect given the deterioration in energy supply risks following last week’s attacks on Qatari gas infrastructure.
While there’s been an inverse relationship with Brent, the broader takeaway is that EUR/USD is no longer trading like a pure proxy for near-term energy prices as was the case earlier in the conflict.
Instead, the price action looks far more aligned with shifts in rate expectations, with EUR/USD behaving more like a reflection of the US curve catching up to those abroad rather than energy markets directly.
EUR/USD downside pressure easing
Source: TradingView
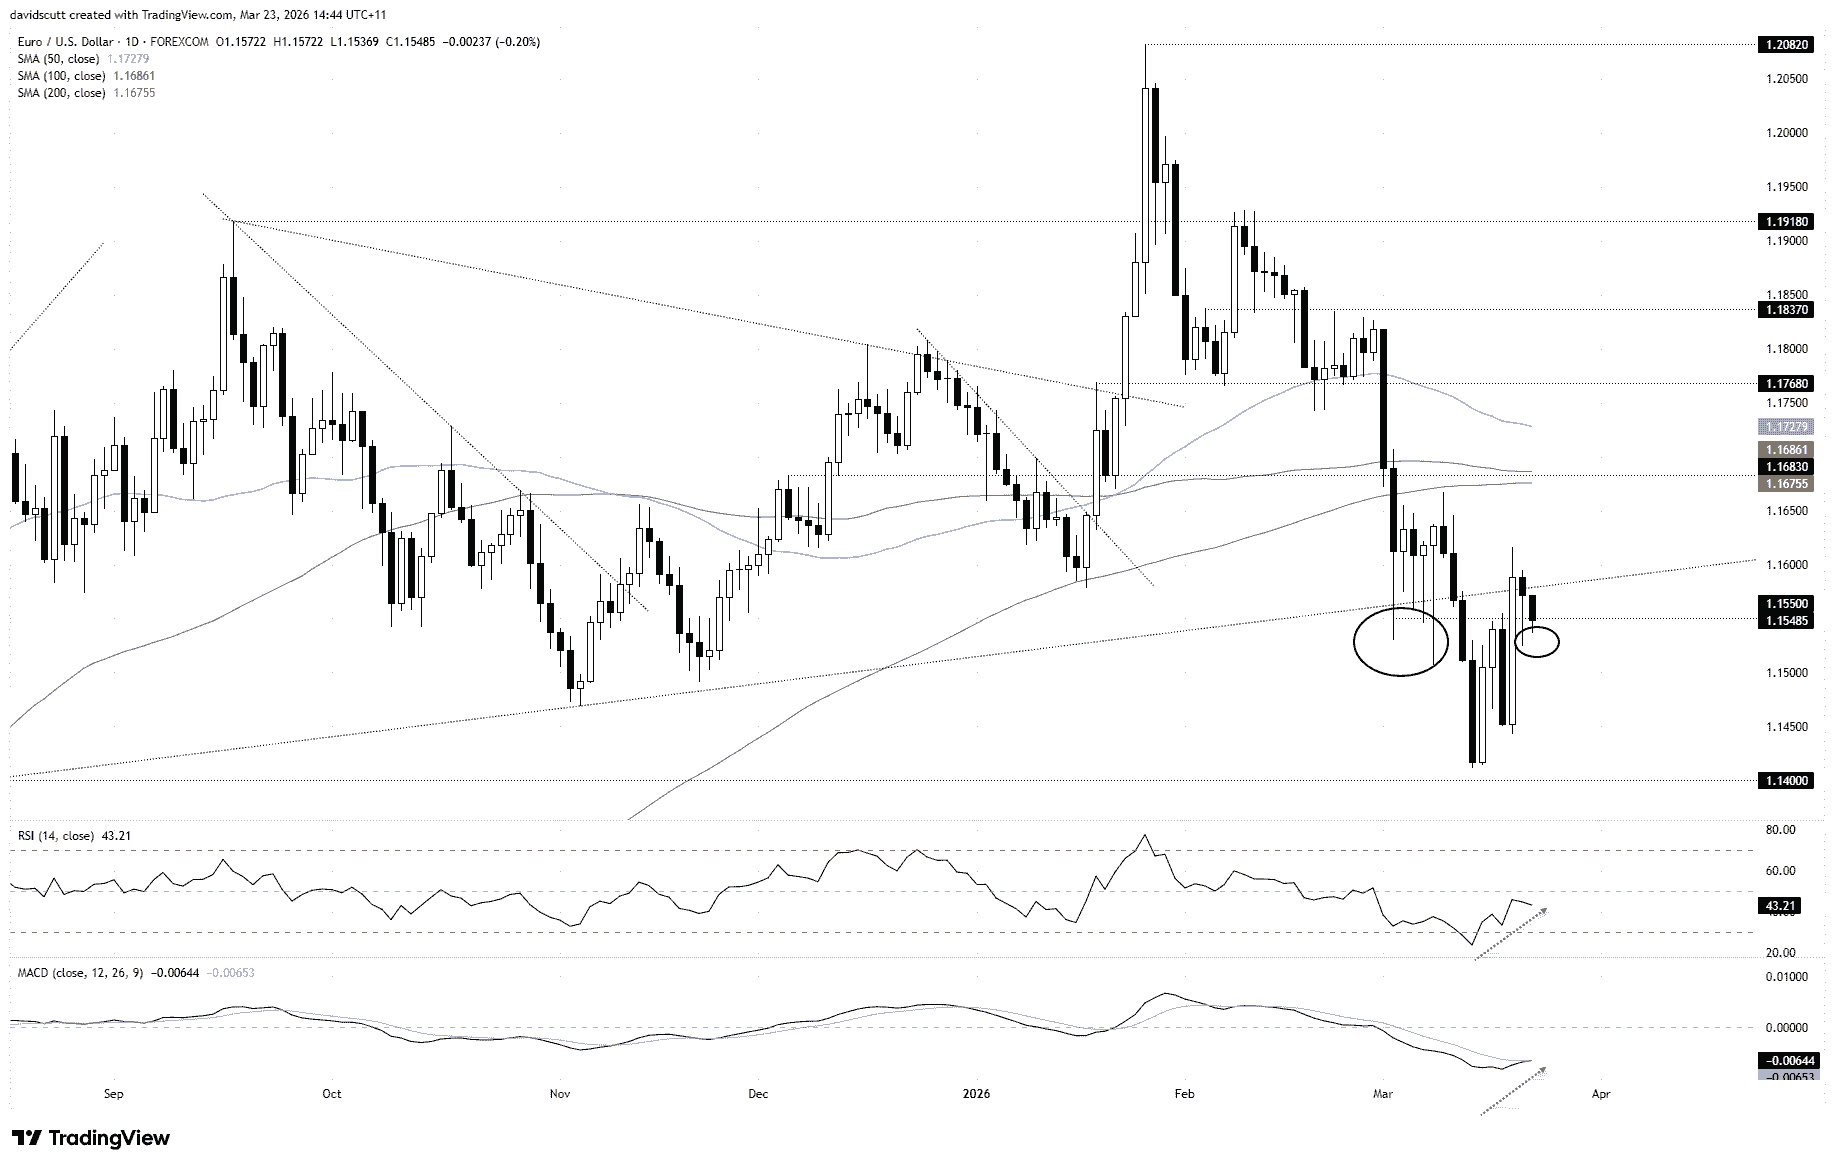
From a technical perspective, the price action has been remarkable over recent days. Despite the broader risk-off move, EUR/USD hasn’t come close to retesting the lows from earlier this month, unlike what we’ve seen in other markets.
RSI (14) is putting in higher lows and pushing back towards the neutral 50 level, while MACD has crossed the signal line from below and is starting to push higher, signalling downside pressure is easing. It comes across as a pair, at least technically, where directional risks are now far more balanced than earlier this month.
1.1550 is the level I’m watching currently. It’s one of those levels that’s entirely untrustworthy to be used as protection, but one you can’t ignore given how regularly price has traded through it before reversing.
For bulls to get excited about a more sustained push higher, the price needs to reclaim former uptrend support dating back to early August last year. We saw a close above that level last Thursday that ultimately proved false, with the high of 1.1615 from that session the level to watch overhead.
A break above would put the confluence of key moving averages and horizontal resistance at 1.1683 on the radar, which looms as a tough test in the current environment.
On the downside, while 1.1550 remains a near-term reference point, buyers stepped in beneath 1.1450 last week, making that level, along with the far more important March 13 swing low just above 1.1400, the key supports to watch.
A break beneath those levels would build confidence that the broader bearish trend is resuming.
Latest market news




Open an account in minutes
Experience award-winning platforms with fast and secure execution, and enjoy tight spreads from 0.5 pts on FX and 0.3 pts on indices.
Economic calendar
Web Trader platform
Our sophisticated web-based platform is packed with features.
Related articles
Japanese Yen Forecast: USD/JPY 4% Rally Challenges Post-Intervention Downtrend 9 24 2026
USD/JPY momentum has shifted sharply higher, putting a major resistance confluence in focus as U.S. and Japanese event risk builds.

Oil Quietly Hands the Fed a Reason to Stay Hawkish
Oil prices and the U.S. dollar are both on the front foot as elevated energy costs feed Fed warnings that inflation may prove sticky.

S&P 500 forecast: Stocks extend drop as correction risks grow
US and global equity markets have extended Wednesday’s sell-off, with Wall Street opening lower after a weak handover from Asia and Europe. The deterioration in risk appetite has been spreading across global markets. The dollar was firmer, Treasury yields were holding onto yesterday’s gains, while gold, silver and bitcoin were all under pressure alongside equities and major currencies.
This report is intended for general circulation only. It should not be construed as a recommendation, or an offer (or solicitation of an offer) to buy or sell any financial products. The information provided does not take into account your specific investment objectives, financial situation or particular needs. Before you act on any recommendation that may be contained in this report, independent advice ought to be sought from a financial adviser regarding the suitability of the investment product, taking into account your specific investment objectives, financial situation or particular needs.
StoneX Financial Pte. Ltd., may distribute reports produced by its respective foreign entities or affiliates within the StoneX group of companies or third parties pursuant to an arrangement under Regulation 32C of the Financial Advisers Regulations. Where the report is distributed to a person in Singapore who is not an accredited investor, expert investor or an institutional investor (as defined in the Securities Futures Act), StoneX Financial Pte. Ltd. accepts legal responsibility to such persons for the contents of the report only to the extent required by law. Singapore recipients should contact StoneX Financial Pte. Ltd. at 6826 9988 for matters arising from, or in connection with the report.
In the case of all other recipients of this report, to the extent permitted by applicable laws and regulations neither StoneX Financial Pte. Ltd. nor its associated companies will be responsible or liable for any loss or damage incurred arising out of, or in connection with, any use of the information contained in this report and all such liability is hereby expressly disclaimed. No representation or warranty is made, express or implied, that the content of this report is complete or accurate.
StoneX Financial Pte. Ltd. is not under any obligation to update this report.
Trading CFDs carries a high level of risk that may not be suitable for some investors. Consider your investment objectives, level of experience, financial resources, risk appetite and other relevant circumstances carefully. The possibility exists that you could lose some or all of your investments, including your initial deposits. If in doubt, please seek independent expert advice. Visit www.forex.com/en-sg/terms-and-policies for the complete Risk Disclosure Statement.