




EUR/USD, USD/CHF, Crude Oil key levels heading into US inflation, FOMC mins
The economic calendar is beginning to ramp up with a key US inflation report, Fed members speaking ahead of the FOMC minutes and a BOC cash rate decision. Today we look at key levels for EUR/USD, USD/CHF and crude oil.
Share this:

The economic calendar is beginning to ramp up with a key US inflation report, Fed members speaking ahead of the FOMC minutes and a BOC cash rate decision.
Implied volatility has spiked for several FX majors over the next 24 hours, with EUR/USD, NZD/USD and USD/JPY 24-hour IV at least double their 20-day average. And that means we could be off to a slow start for today's European session until US CPI data is released just after lunch. The BOC are not expected to change policy, although they might tip their hat to lower inflation and softer CPI expectations in their statement. We also have several Fed members speaking after US CPI, which could mix things u a bit.
Today we look at key levels for EUR/USD, USD/CHF and crude oil.
Events in focus (GMT +1):
- 13:30 – US inflation
- 13:45 – Fed Bowman speaks
- 14:45 – BOC interest rate decision, statement (no change expected)
- 15:30 – Crude oil inventories
- 15:30 – BOC press conference
- 17:45 – Fed Goolsbee, Barkin Speaks
- 19:00 – FOMC minutes
EUR/USD technical analysis (4-hout chart):
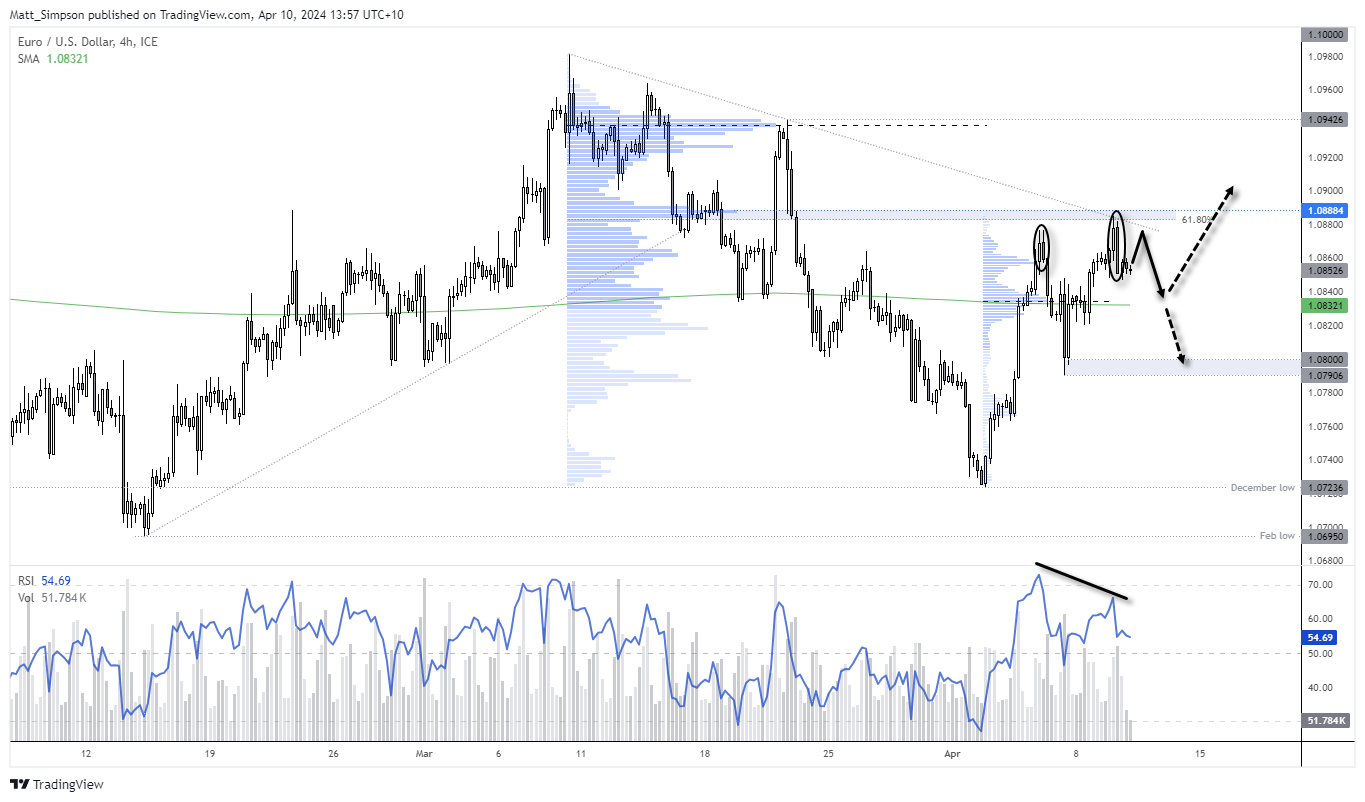
EUR/USD enjoyed a solid rally from the December low early last week, although that rally now appears to be losing steam. Tuesday’s high only managed a marginal gain above Friday’s high which has allowed a bearish divergence to form with the RSI (14). And a 2-bar bearish reversal (which includes and engulfing candle) formed around a 61.8% Fibonacci retracement level, high-volume node and trend resistance.
I suspect we’re in for some quiet trade over the next few hours, with the potential for some sharp moves in the lead up to the US inflation report as the market seeks out liquidity to absorb. And my guess is this could see the market move higher to fill some liquidity gaps within the previous bearish engulfing candle, before the CPI figures drop and the ‘real move’ commences.
Today’s bias is to fade into moves beneath yesterday’s highs, in anticipation of a move lower towards the 200-day MA and high-volume node around 1.0832, a break beneath which brings 1.0820 and 1.0800 into focus.
USD/CHF technical analysis (4-hout chart):
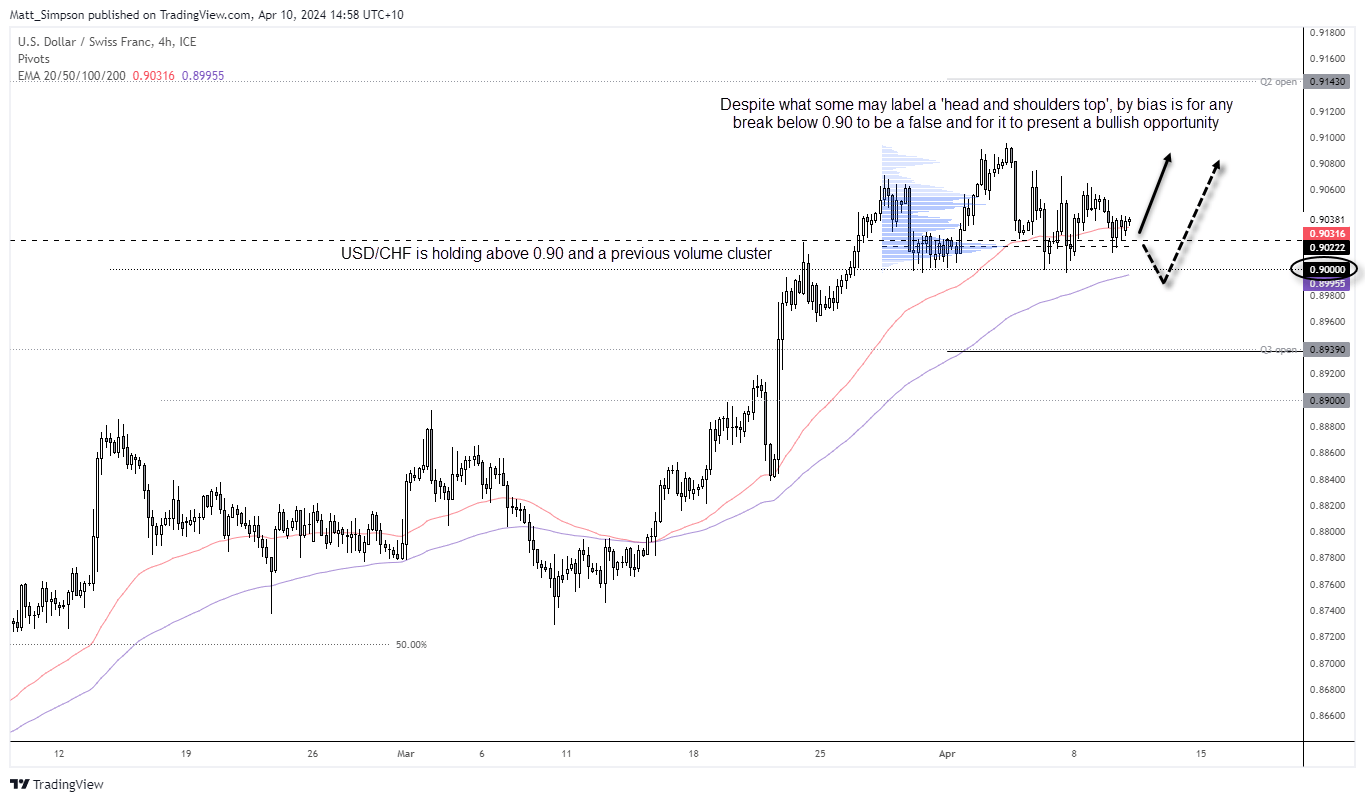
The continued weakness of the Swiss franc has allowed a much cleaner bullish trend on USD/CHF compared with the relative dollar performance against other forex majors. It reached my 0.90 target at the end of March and entered a period od consolidation, and is forming what some may call a ‘head and shoulders’ top pattern.
However, my bias is for the trend to continue higher given its respect of 0.90 as support. And should prices dip beneath that key level, I suspect it will be short lived and snapped up by bulls to deem any downside break of 0.90 as a fakeout before continuing higher.
Bulls could either see dips towards 0.90 or ait for a break above the current consolidation to assume bullish trend continuation.
WTI crude oil technical analysis (4-hout chart):
I noted in this week’s COT report that managed funds and large speculators are piling into long bets of crude oil, yet shorts remain subdued. And that means that market positioning alongside the bullish price action has placed crude oil remains on my ‘buy the dip’ watchlist.
The trend structure is clearly bullish on the 4-hour chart and it trades well within a broader bullish channel. An internal trendline hints at support around $84, so any dips towards it will pique my bullish interest. Besides, crude oil does not appear to have yet completed a 3-wave retracement, which can be standard in such trends. And RSI (14) has not yet dipped to oversold, which has been upgraded to 40 as it is within an uptrend.
Therefore, the bias is for a deeper pullback towards $84 before bullish momentum returns and pushes crude oil prices to a new cycle high.
-- Written by Matt Simpson
Follow Matt on Twitter @cLeverEdge
How to trade with City Index
You can trade with City Index by following these four easy steps:
- Open an account, or log in if you’re already a customer
• Open an account in the UK
• Open an account in Australia
• Open an account in Singapore
- Search for the market you want to trade in our award-winning platform
- Choose your position and size, and your stop and limit levels
- Place the trade
Related tags:


Open an account in minutes
Experience award-winning platforms with fast and secure execution, and enjoy tight spreads from 0.5 pts on FX and 0.3 pts on indices.
Economic calendar
Web Trader platform
Our sophisticated web-based platform is packed with features.
Related articles
Tankan Backs BOJ Tightening, but Yen Rate Expectations Ease
Japan’s Tankan supports further BOJ tightening, although softer rate expectations could limit support for the Japanese yen.

Nikkei breakout accelerates as yen weakness returns
Nikkei has started October with a powerful breakout, helped by renewed yen weakness and strong upside momentum


AUD/USD hammered by US yields and fading RBA hike bets
US yields, dollar strength and fading RBA hike bets have combined to drive AUD/USD to fresh multi-month lows. The macro and technical bias remains bearish, although history suggests parts of the move are now reaching unusually stretched levels.
This report is intended for general circulation only. It should not be construed as a recommendation, or an offer (or solicitation of an offer) to buy or sell any financial products. The information provided does not take into account your specific investment objectives, financial situation or particular needs. Before you act on any recommendation that may be contained in this report, independent advice ought to be sought from a financial adviser regarding the suitability of the investment product, taking into account your specific investment objectives, financial situation or particular needs.
StoneX Financial Pte. Ltd., may distribute reports produced by its respective foreign entities or affiliates within the StoneX group of companies or third parties pursuant to an arrangement under Regulation 32C of the Financial Advisers Regulations. Where the report is distributed to a person in Singapore who is not an accredited investor, expert investor or an institutional investor (as defined in the Securities Futures Act), StoneX Financial Pte. Ltd. accepts legal responsibility to such persons for the contents of the report only to the extent required by law. Singapore recipients should contact StoneX Financial Pte. Ltd. at 6826 9988 for matters arising from, or in connection with the report.
In the case of all other recipients of this report, to the extent permitted by applicable laws and regulations neither StoneX Financial Pte. Ltd. nor its associated companies will be responsible or liable for any loss or damage incurred arising out of, or in connection with, any use of the information contained in this report and all such liability is hereby expressly disclaimed. No representation or warranty is made, express or implied, that the content of this report is complete or accurate.
StoneX Financial Pte. Ltd. is not under any obligation to update this report.
Trading CFDs carries a high level of risk that may not be suitable for some investors. Consider your investment objectives, level of experience, financial resources, risk appetite and other relevant circumstances carefully. The possibility exists that you could lose some or all of your investments, including your initial deposits. If in doubt, please seek independent expert advice. Visit www.forex.com/en-sg/terms-and-policies for the complete Risk Disclosure Statement.