



Euro Weekly Forecast into ECB: EUR/USD, EUR/JPY
Next week brings the European Central Bank rate decision and the big question is whether the bank will be hiking rates in the coming months.
Share this:

The backdrop in EUR/USD is likely to be determined at least partially by the time frame with which the trader or analyst is looking. From a fundamental basis, there’s been periods where the backdrop has appeared to be divorced from the price action such as the sliding sell-off in March even as the European Central Bank was widely considered to be on the way to rate hikes. But, realistically, it was the confusion around oil prices and the implications around that which was likely driving the waves, and as we go into next week, in which we’ll get both European CPI data and a European Central Bank rate decision, EUR/USD can be justified in either direction depending on the vantage point that it’s being looked at.
From the weekly chart, we have price re-testing a massive area of importance, the same 76.4-78.6% expanse from the 2021-2022 major move, a zone that’s been in-play for more than nine months now as the massive rally of 2025 met it’s match at that zone.
From the below chart, it looks like a stall at a lower-high following a lower-low, thereby keeping the door open for sellers to make a push until or unless resistance can be tested through.
EUR/USD Weekly Price Chart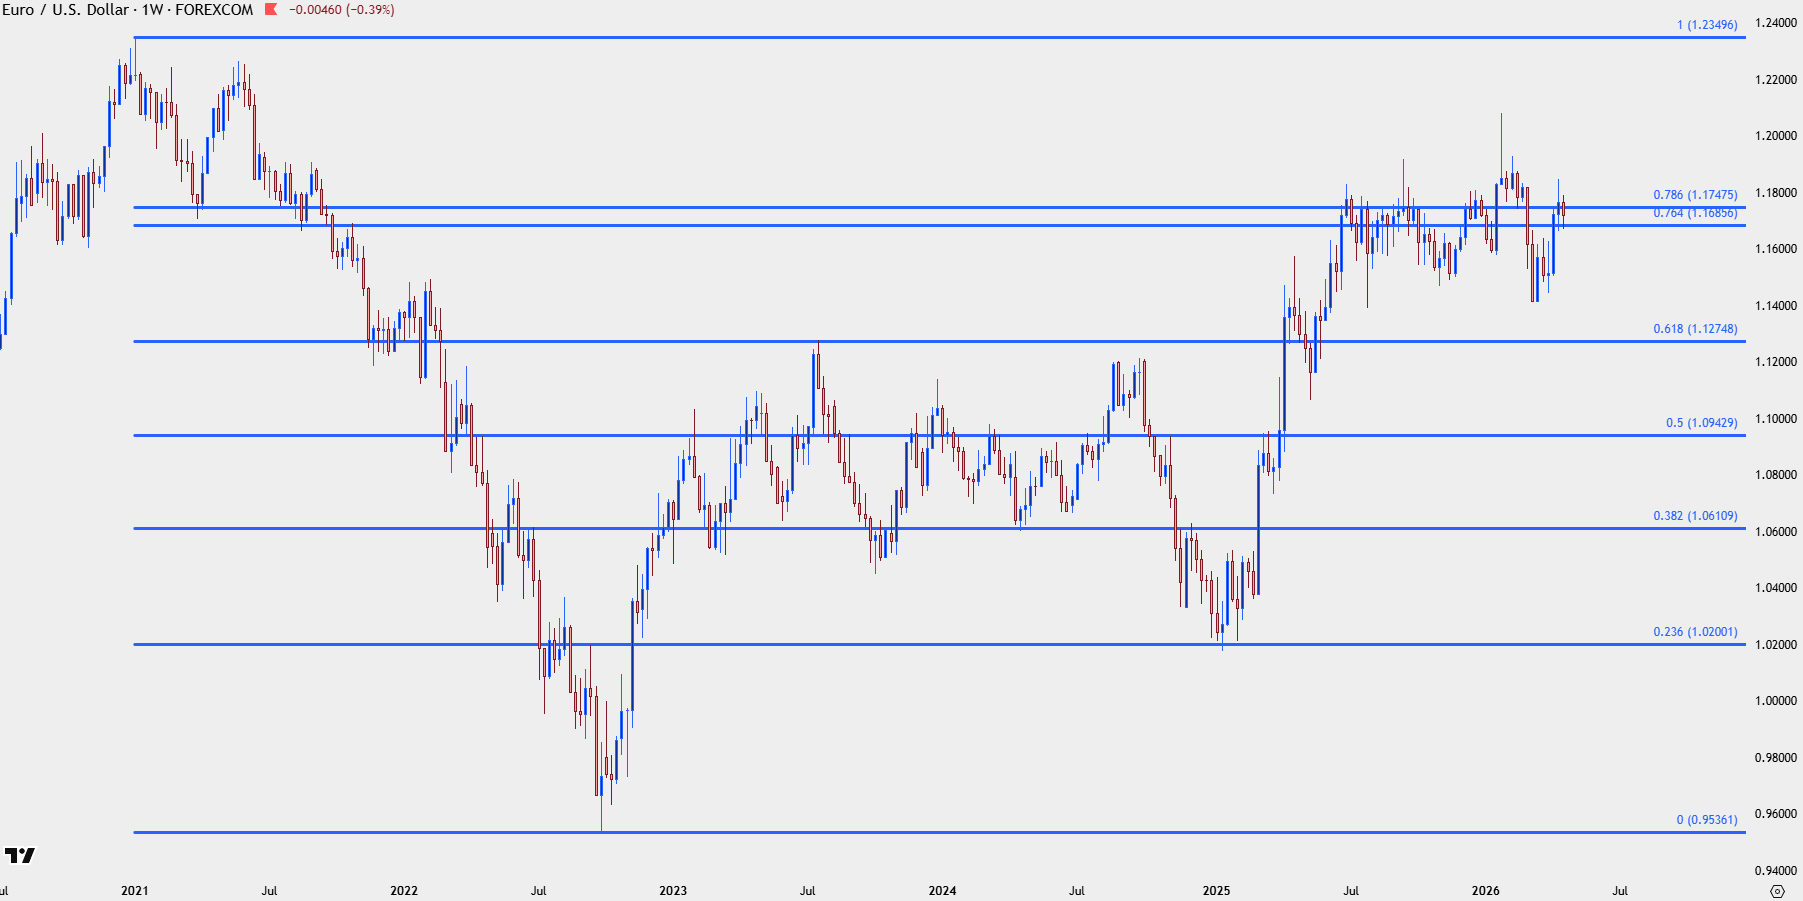
Chart prepared by James Stanley; data derived from Tradingview

EUR/USD Daily
From the daily, and this is what I had looked at in the USD article on Friday, this is simpler to justify on the long side given the recent higher-high and the pullback that, so far, has held support around the 76.4% retracement of the move looked at above. There’s even scope for deeper support, to around 1.1628-1.1655, which can keep the door open for bullish continuation scenarios.
Key resistance at this point is the same 1.1835 level that held the highs right around when the USD was probing for support around the 97.94 Fibonacci level.
EUR/USD Daily Price Chart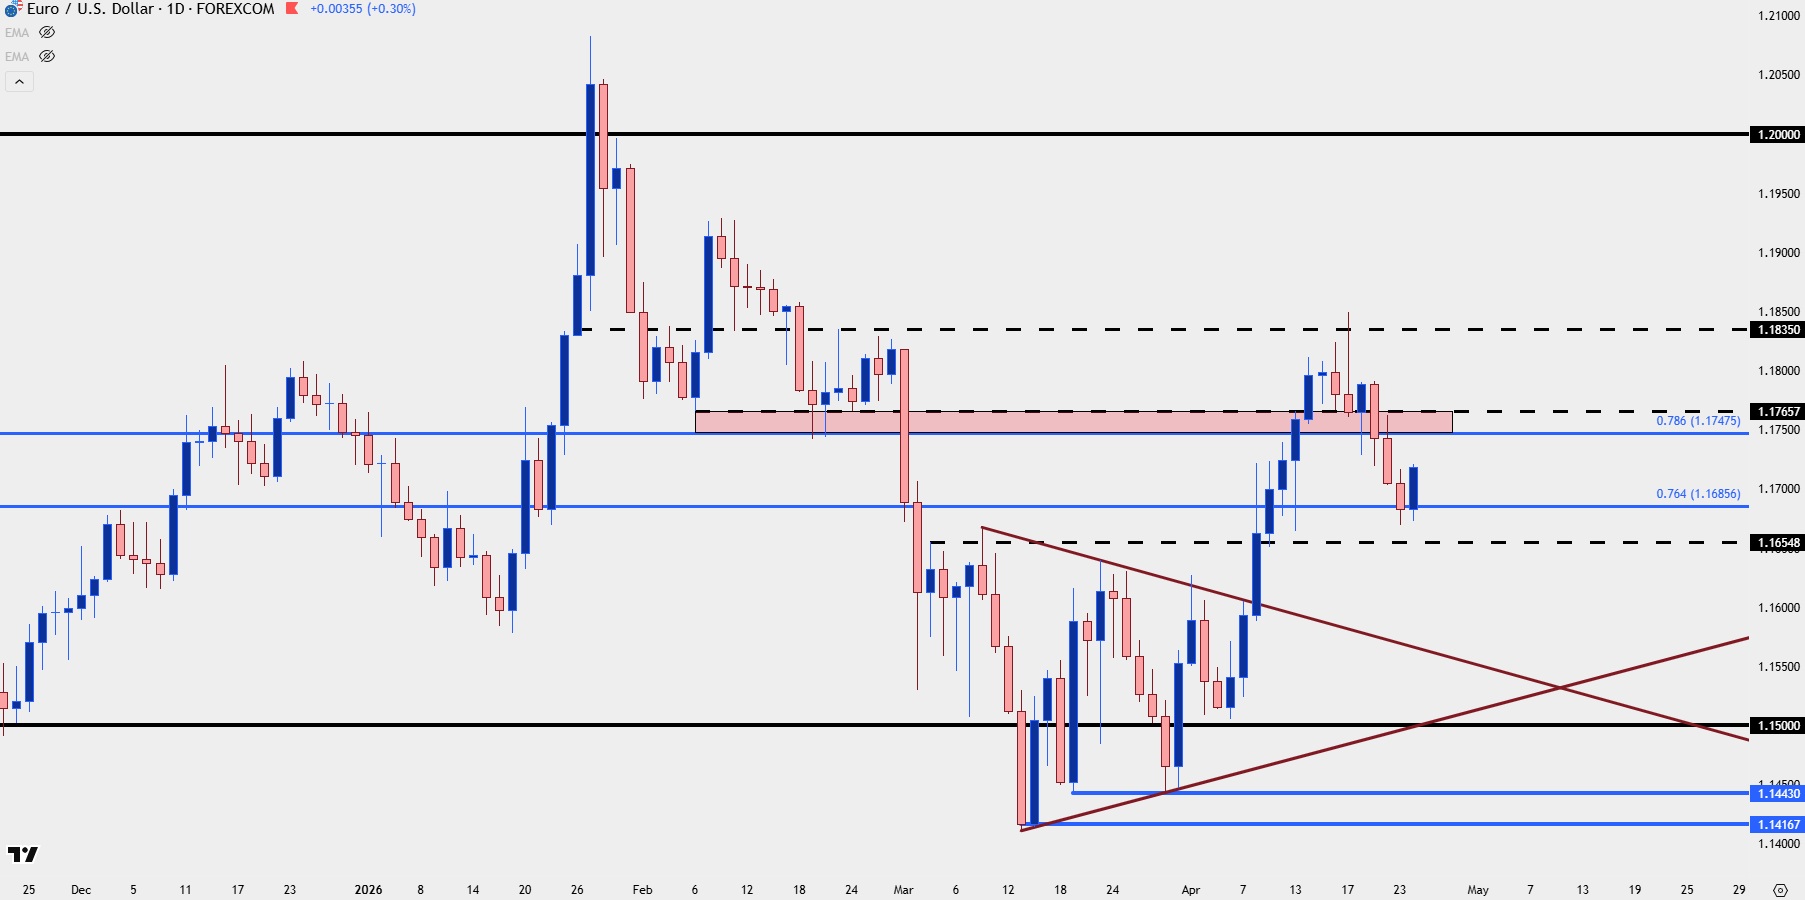
Chart prepared by James Stanley; data derived from Tradingview
EUR/USD Intra-Day
From the four-hour chart, we can see that the bounce is still young and it’s the 1.1748-1.1766 zone that stands out as an area that bulls can stake their claim. Buyers would need to press above that to make a more convincing move, which would then open the door for a re-test of resistance at 1.1835, and perhaps more beyond that level.
For next week, I’m considering EUR/USD as one of the more attractive backdrops for USD-weakness and the daily chart above is a big reason why.
EUR/USD Four-Hour Price Chart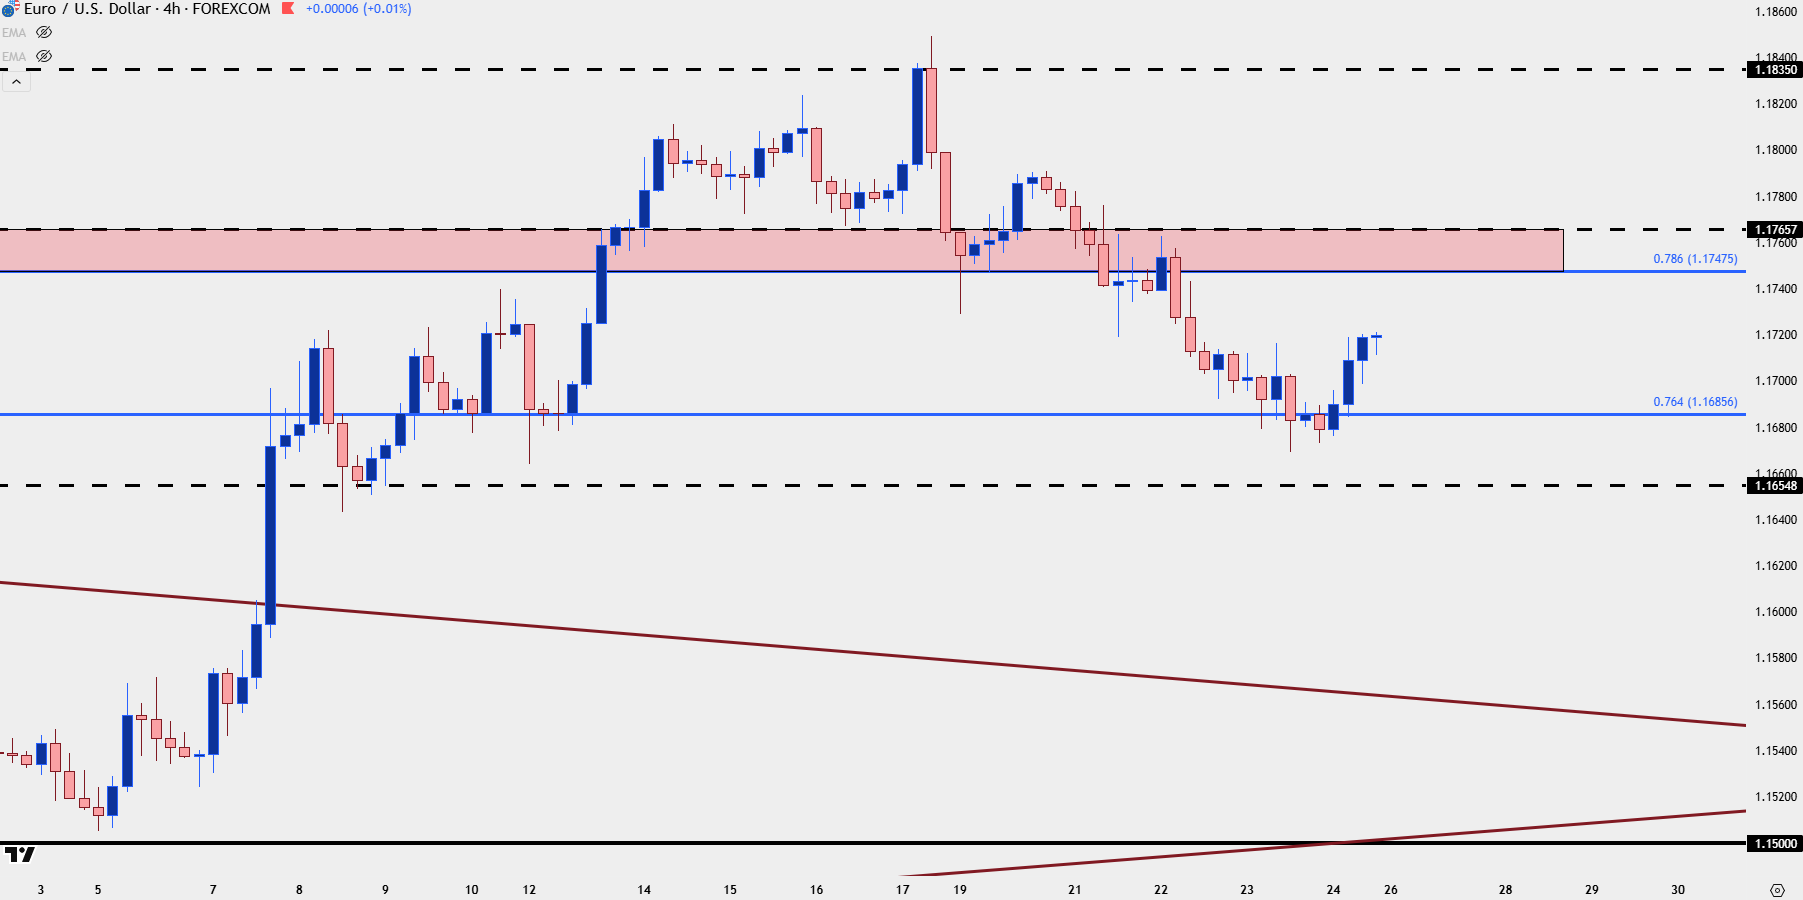
Chart prepared by James Stanley; data derived from Tradingview
EUR/JPY
Next week is big for the Yen with the Bank of Japan rate meeting earlier in the week, and as we came into last week, the EUR/JPY pair was in the midst of a massive breakout.
For the past two weeks, however, that stunning strength has turned into indecision following the bull pennant breakout.
EUR/JPY Weekly Chart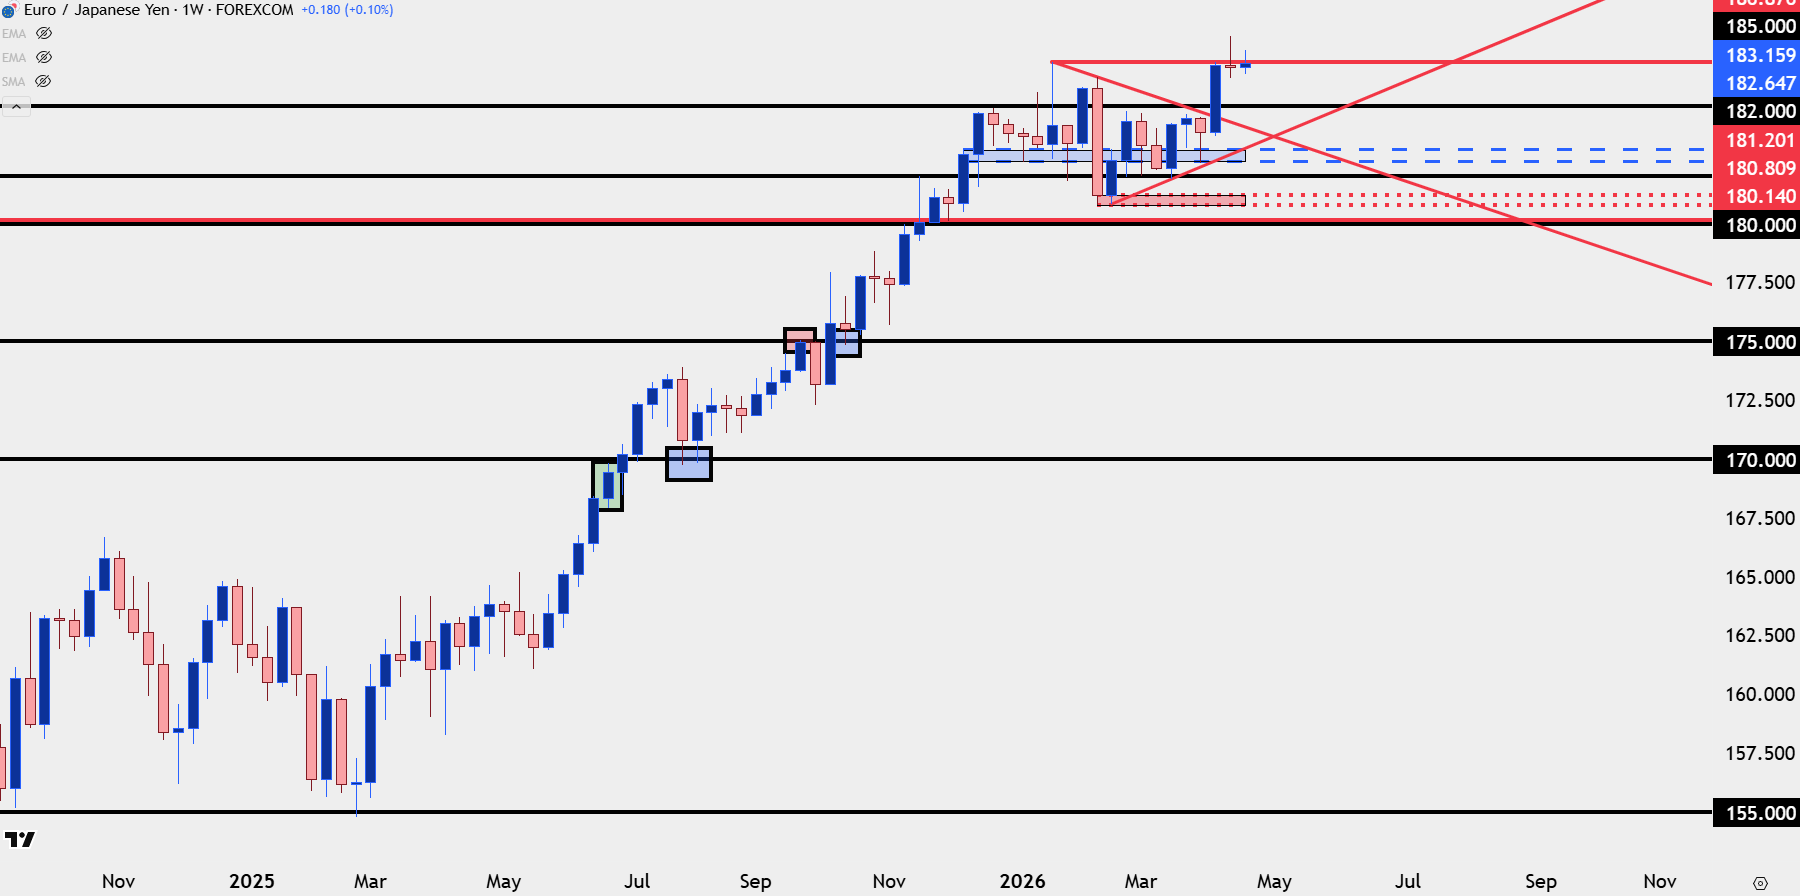
Chart prepared by James Stanley; data derived from Tradingview
EUR/JPY Daily
As I looked at in the US Dollar article earlier, I think the USD/JPY pair is the main push point for FX markets next week with the Bank of Japan rate decision and the prospect of rate hikes from the BoJ in the coming months. If Ueda sounds hawkish and frightens carry traders, we can see fast unwind. If he’s too soft and doesn’t seem ready to hike, we could see the 160.00 level tested which could spur a round of Yen-weakness elsewhere.
Looking at EUR/JPY in a vacuum, and it looks like there could be a deeper pullback as horizontal support and lower-highs makes for a short-term descending triangle formation. That wouldn’t necessarily have to turn into a full-fledged reversal, as it may simply be a pullback in the broader bullish trend that opens the door for re-test of the 185.00 level.
EUR/JPY Daily Price Chart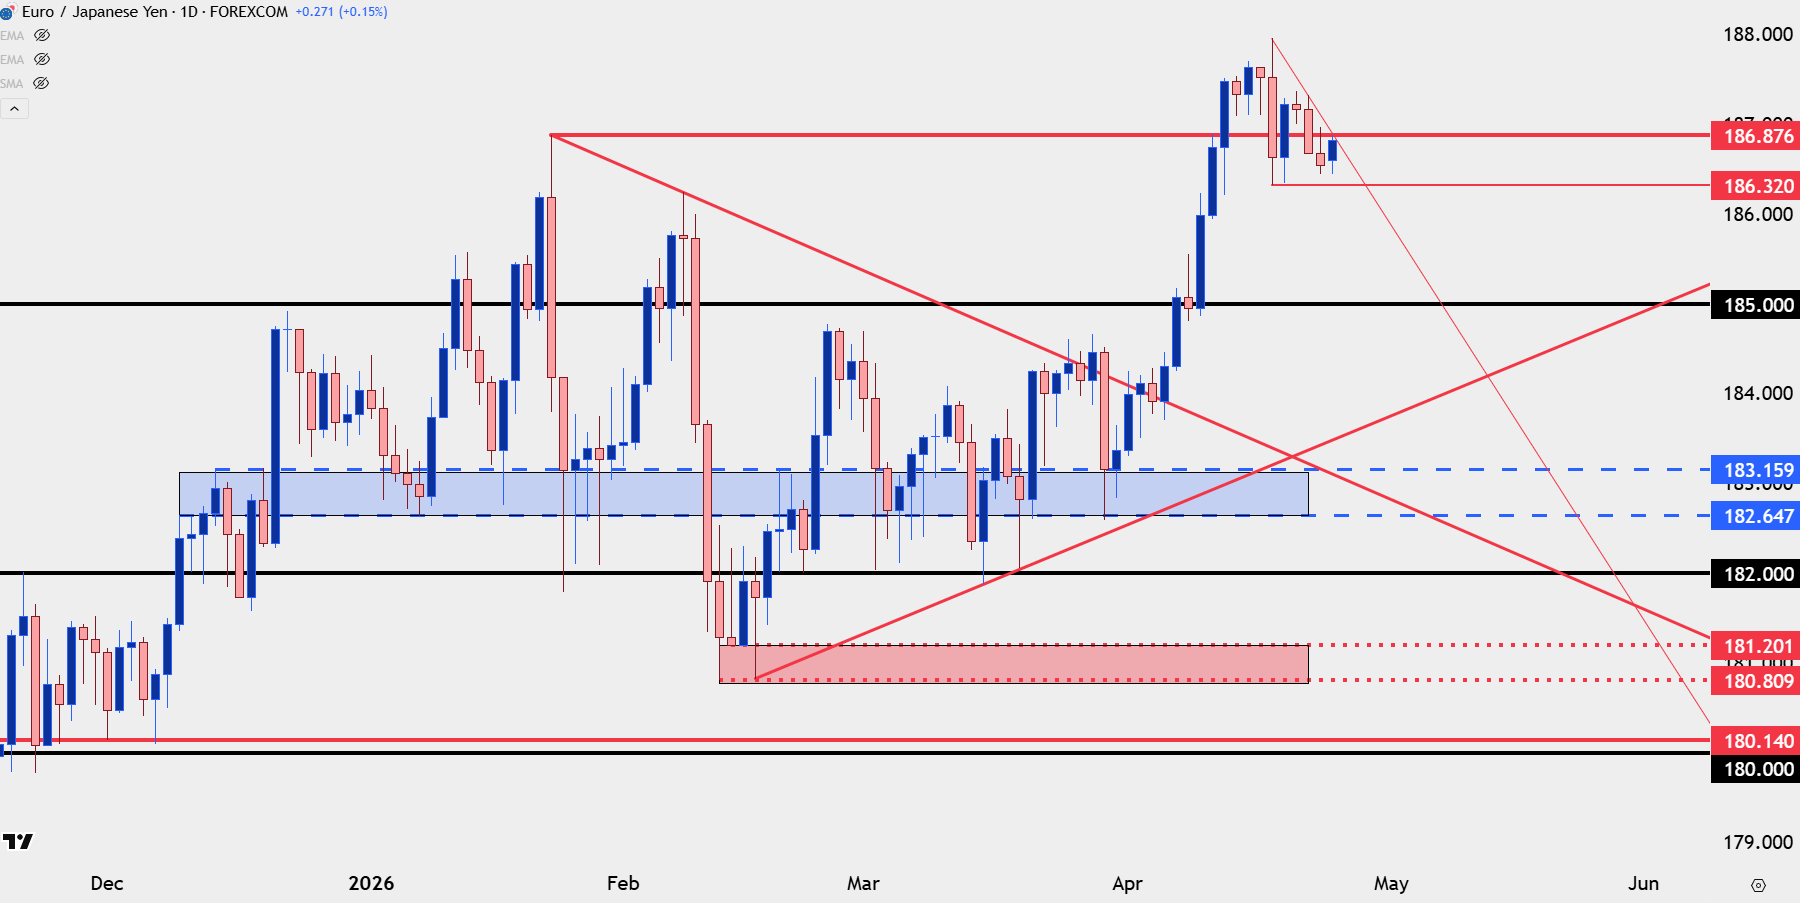
Chart prepared by James Stanley; data derived from Tradingview
--- written by James Stanley, Senior Market Analyst, Global Macro




Open an account in minutes
Experience award-winning platforms with fast and secure execution, and enjoy tight spreads from 0.5 pts on FX and 0.3 pts on indices.
Economic calendar
Web Trader platform
Our sophisticated web-based platform is packed with features.
Related articles

US Dollar Price Action Setups: EUR/USD, GBP/USD, USD/JPY, USD/CAD
The US Dollar finished last week with a bearish engulf following a four-week winning streak. But the big question now is whether the Euro can pose any form of a recovery.

Euro Technical Outlook: EUR/USD Bulls Face Critical Test After Support Rebound 10 20 2026
EUR/USD has cleared its September downtrend, but buyers still need to prove the advance can develop into a more sustained bullish reversal.


EUR/USD forecast remains tilted lower towards 1.10 handle
The EUR/USD forecast remains tilted to the downside, and a visit of 1.1000 is still on the cards, despite today’s small recovery.

This report is intended for general circulation only. It should not be construed as a recommendation, or an offer (or solicitation of an offer) to buy or sell any financial products. The information provided does not take into account your specific investment objectives, financial situation or particular needs. Before you act on any recommendation that may be contained in this report, independent advice ought to be sought from a financial adviser regarding the suitability of the investment product, taking into account your specific investment objectives, financial situation or particular needs.
StoneX Financial Pte. Ltd., may distribute reports produced by its respective foreign entities or affiliates within the StoneX group of companies or third parties pursuant to an arrangement under Regulation 32C of the Financial Advisers Regulations. Where the report is distributed to a person in Singapore who is not an accredited investor, expert investor or an institutional investor (as defined in the Securities Futures Act), StoneX Financial Pte. Ltd. accepts legal responsibility to such persons for the contents of the report only to the extent required by law. Singapore recipients should contact StoneX Financial Pte. Ltd. at 6826 9988 for matters arising from, or in connection with the report.
In the case of all other recipients of this report, to the extent permitted by applicable laws and regulations neither StoneX Financial Pte. Ltd. nor its associated companies will be responsible or liable for any loss or damage incurred arising out of, or in connection with, any use of the information contained in this report and all such liability is hereby expressly disclaimed. No representation or warranty is made, express or implied, that the content of this report is complete or accurate.
StoneX Financial Pte. Ltd. is not under any obligation to update this report.
Trading CFDs carries a high level of risk that may not be suitable for some investors. Consider your investment objectives, level of experience, financial resources, risk appetite and other relevant circumstances carefully. The possibility exists that you could lose some or all of your investments, including your initial deposits. If in doubt, please seek independent expert advice. Visit www.forex.com/en-sg/terms-and-policies for the complete Risk Disclosure Statement.