


EUR/USD, USD/JPY Analysis: The yen dominates the session ahead of US data
Whilst the US dollar extended its gains against most FX majors, it was no match for the Japanese yen which took in safe-haven flows as Asian stocks traded lower. Attention now shifts to a set of key economic data points from the US including job cuts, ADP employment, claims data and two service PMI reports.
Share this:

Asian Indices:
- Australia's ASX 200 index fell by -90.5 points (-1.25%) and currently trades at 7,162.70
- Japan's Nikkei 225 index has fallen by -580.27 points (-1.74%) and currently trades at 32,758.43
- Hong Kong's Hang Seng index has fallen by -567.33 points (-2.97%) and currently trades at 18,543.05
- China's A50 Index has fallen by -88.93 points (-0.71%) and currently trades at 12,501.14
UK and Europe:
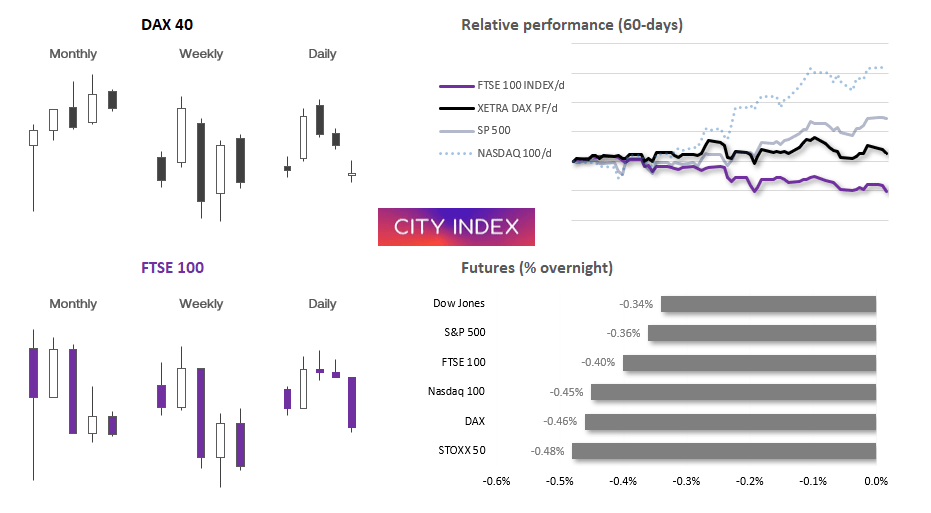
- UK's FTSE 100 futures are currently down -29 points (-0.39%), the cash market is currently estimated to open at 7,413.10
- Euro STOXX 50 futures are currently down -20 points (-0.46%), the cash market is currently estimated to open at 4,330.71
- Germany's DAX futures are currently down -71 points (-0.44%), the cash market is currently estimated to open at 15,866.58
US Futures:
- DJI futures are currently down -115 points (-0.33%)
- S&P 500 futures are currently down -15.75 points (-0.35%)
- Nasdaq 100 futures are currently down -68.25 points (-0.44%)
US-Sino relations continue to sour
Sentiment soured for equity bulls at the Asian open, as Sino-US relations took another step backwards and investors adjusted to the fact that the Fed remain more hawkish than hoped. The Fed’s decision to pause was not actually unanimous and most members are up for further hikes, so this could cap upside over the near-term. That said, US futures are holding higher and we’ve seen Asian indices close their opening gaps, so it seems to be more of a bump in the road as opposed to blood on the streets. We expect cautions trading from here ahead of the ISM services report overnight and US employment data, ahead of tomorrow’s Nonfarm payroll report.
US PMIs and employment data in focus
With US manufacturing data deteriorating further this week, we could see the US dollar hand bac some gains if today’s services PMIs also falter. S&P global release their service PMI at 13:45 and is expected to pull back to a 53 from 54.3. However, the ISM non-manufacturing survey is likely to gain the most attention to see if it falls below 50 to denote contraction, having come close last month with a print of just 50.3. With new orders also trending lower, a contraction today is very possible. Whilst this points to a weaker economy, I would not be surprised to see Wall Street celebrate as indices seem to like data which points towards a less-hawkish Fed. It could also weigh on the dollar as traders scale back some of yesterday’s hawkish bets.
Of course, if we’re to be treated with strong US employment data alongside better-than-expected PMI data, the US dollar might rip higher as fresh bets are placed for another couple of Fed hikes.

Hawkish FOMC minutes helped the US dollar continue to strengthen against most FX majors overnight, although a combination of softer PMI data from China and a step backwards for US-Sino relations saw the Japanese yen as the stronger FX major overnight. China has warned the US that its decision to curb key metals exports for microchips is “just the start”, just days ahead of Treasury Secretary Yellen’s visit to China.
USD/CHF is drifting up to the top of its three-week range and is just 10-pips from the 0.90 handle, which could leave the potential for some mean reversion lower (assuming the range holds) or have traders on guard for a bullish breakout.
Gold has pulled back from yesterday’s lows after printing a bearish engulfing / outside day. Fresh rate-hike bets could weigh on gold, and we’re waiting to see if it finds resistance within yesterday’s range for a potential swing-trade short. Potential intraday resistance levels include the 1919.89 low, 1922.46 (38.2% Fibonacci retracement) and 1923.86 (volume cluster).
WTI crude oil rose above Monday’s bearish hammer high to invalidate yesterday’s near-term, bearish bias. Yet with resistance clusters around the 72 and 73 handles, weak China data and increased bearish exposure for large speculators, we prefer to maintain range-trading strategies unless there’s a compelling reason for large shorts to exit and create a bullish breakout.
EUR/USD daily chart:


EUR/USD is trading below 1.0850 but managing to hold above last week’s low (just about). Whilst RSI (2) is within the oversold level, we’d need to wait for the daily close to confirm. But the lack of bearish follow-through during the Asian session suggests it may at least try to post a minor rebound. Who knows, if Germany’s PMI data is upwardly revised whilst US data sinks, perhaps it could have the legs to retest 1.0900 (although that seems unlikely given the lower levels of volatility). If data is to be stacked the other way, 1.0800 is the next major support level, although the reward to risk for bears is unfavourable with the 50% retracement line at 1.0825.
USD/JPY 1-hour chart:


USD/JPY has broken below the 144 handle after effectively falling since the Tokyo open, and has already used 87% of its 20-day ADR (average daily range). Yet the 1 and 5-day implied volatility remains below average, although that could change if today’s data diverges enough away from expectations.
Whilst momentum clearly points lower, bears may wat to wait for a retracement before seeking shorts. Besides, the London open is notorious for volatile shakeouts so perhaps we’ll see a technically-driven retracement higher. IN which case, bears could potential seek a lower-volatility entrance below resistance. A move towards 143.40 / 143 is favoured, but we’d prefer to avoid entering near cycle lows if possible.
-- Written by Matt Simpson
Follow Matt on Twitter @cLeverEdge
How to trade with City Index
You can trade with City Index by following these four easy steps:
- Open an account, or log in if you’re already a customer
• Open an account in the UK
• Open an account in Australia
• Open an account in Singapore
- Search for the market you want to trade in our award-winning platform
- Choose your position and size, and your stop and limit levels
- Place the trade
Related tags:
Latest market news




Open an account in minutes
Experience award-winning platforms with fast and secure execution, and enjoy tight spreads from 0.5 pts on FX and 0.3 pts on indices.
Economic calendar
Web Trader platform
Our sophisticated web-based platform is packed with features.
Related articles
Australian Dollar Outlook: AUD/USD Holds 70c Ahead of RBA and CPI
AUD/USD faces an expected RBA hike and Australian CPI before attention turns to US PCE, ISM and nonfarm payrolls later in the week.
EUR/USD weekly outlook: Oil, inflation and NFP in focus
After coming under significant pressure in recent weeks, the EUR/USD came off its lows to finish the week on a positive note on Friday, albeit with only a mild rebound. That was not enough to prevent the exchange rate falling for the third consecutive week, as the US dollar and bond yields rallied across the board.

USD/JPY Weekly Outlook: Payrolls loom as US rates remain the dominant driver
Strong US growth and hawkish Fed pricing continue to support USD/JPY, while intervention risk appears to be kicking in at lower levels

This report is intended for general circulation only. It should not be construed as a recommendation, or an offer (or solicitation of an offer) to buy or sell any financial products. The information provided does not take into account your specific investment objectives, financial situation or particular needs. Before you act on any recommendation that may be contained in this report, independent advice ought to be sought from a financial adviser regarding the suitability of the investment product, taking into account your specific investment objectives, financial situation or particular needs.
StoneX Financial Pte. Ltd., may distribute reports produced by its respective foreign entities or affiliates within the StoneX group of companies or third parties pursuant to an arrangement under Regulation 32C of the Financial Advisers Regulations. Where the report is distributed to a person in Singapore who is not an accredited investor, expert investor or an institutional investor (as defined in the Securities Futures Act), StoneX Financial Pte. Ltd. accepts legal responsibility to such persons for the contents of the report only to the extent required by law. Singapore recipients should contact StoneX Financial Pte. Ltd. at 6826 9988 for matters arising from, or in connection with the report.
In the case of all other recipients of this report, to the extent permitted by applicable laws and regulations neither StoneX Financial Pte. Ltd. nor its associated companies will be responsible or liable for any loss or damage incurred arising out of, or in connection with, any use of the information contained in this report and all such liability is hereby expressly disclaimed. No representation or warranty is made, express or implied, that the content of this report is complete or accurate.
StoneX Financial Pte. Ltd. is not under any obligation to update this report.
Trading CFDs carries a high level of risk that may not be suitable for some investors. Consider your investment objectives, level of experience, financial resources, risk appetite and other relevant circumstances carefully. The possibility exists that you could lose some or all of your investments, including your initial deposits. If in doubt, please seek independent expert advice. Visit www.forex.com/en-sg/terms-and-policies for the complete Risk Disclosure Statement.