







EURUSD Slightly Leading DXY
One could expect the DXY to push higher through the near term resistance levels.
Share this:
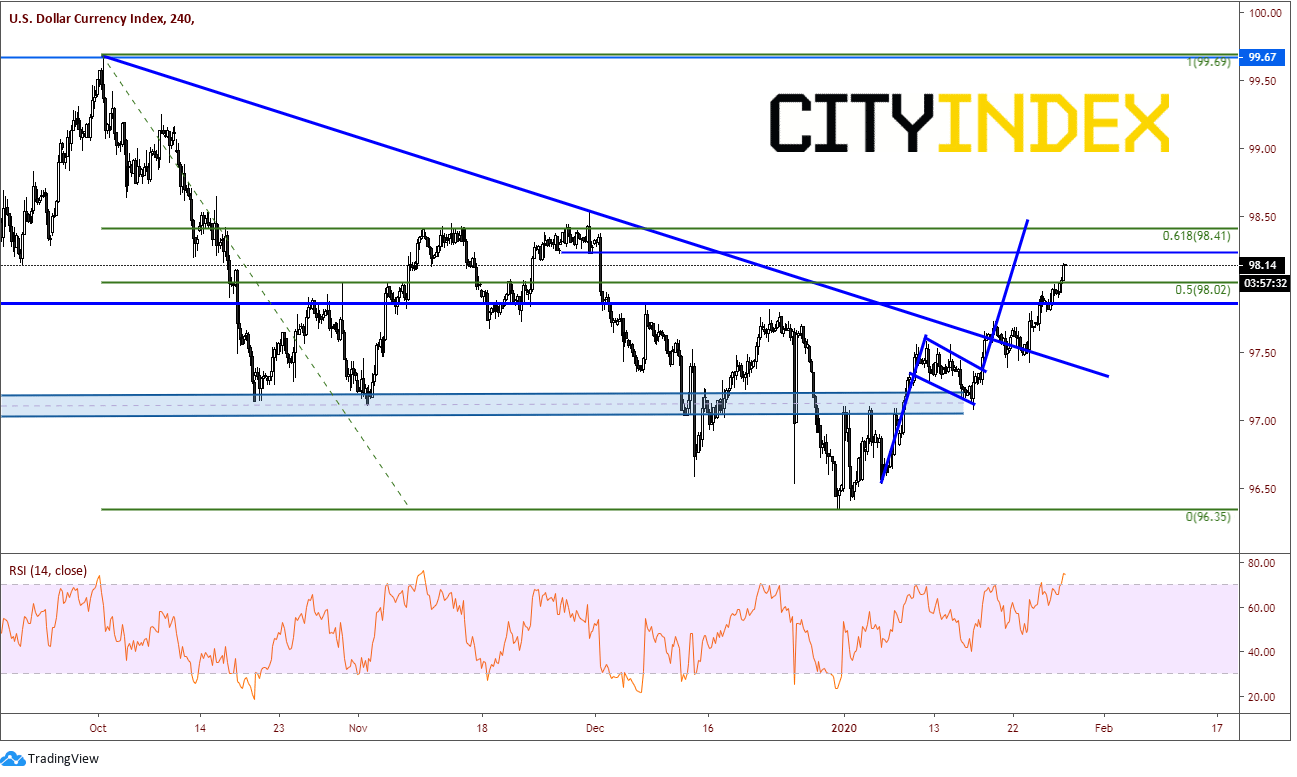
Since January 1st of this new year, the US Dollar Index (DXY) has been on a one way move higher. The index has been in a long-term channel since mid 2018, and finally broke below it in December, only to be halted at the 50% retracement level from the lows on June 13th , 2018 to the highs on October 1st of last year. More recently, over the last 2 weeks, the DXY has broken through a key inflection point near 97.50/97.75. At this level, price broke through:
- The upper trendline of the downward sloping channel, formed off the October 1st highs.
- The bottom trendline line of the upward slopping channel from 2015
- The 200 Day Moving Average
Source: Tradingview, City Index
On a 240-minuted chart of the DXY, the upward trend is in full effect. However, there is plenty of resistance just above. Price is currently trading near 98.15. There is horizontal resistance near 98.25, as well as the 61.8% retracement level from the October 1st highs to the December 31sr lows near 98.40. (98.50 is the target for the flag pattern which was formed off the lows as well). On addition, the RSI is over 75. Any reading above 70 is worth watching for possible pullbacks in price.
Source: Tradingview, City Index
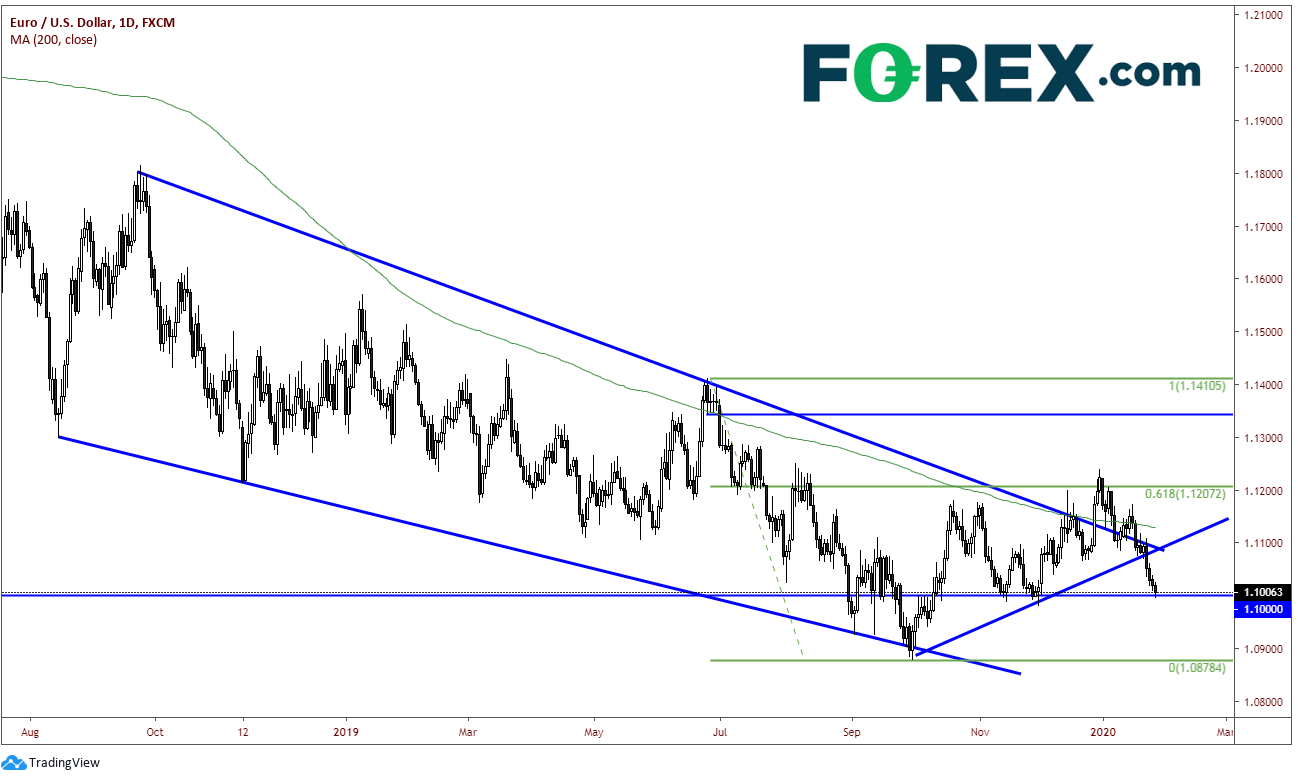
The Euro makes up almost 58% of the US Dollar index. So, it is no surprise that as the US Dollar Index moves higher, the EUR/USD would move lower. The EUR/USD was in a falling wedge since mid-2018, and on December broke higher out of the wedge. Price halted at the 61.8% retracement level from the highs on June 24th to the lows October 1st and reversed. More recently, over the last 2-week, EUR/USD has broken through a key inflection area near 1.1100. Near this level, price broke through:
- The 200 Day moving average near 1.1135
- The upper trendline of the falling wedge
- The rising trendline off the lows from October 1st
Price is currently at horizontal and psychological support near 1.1000.
Source: Tradingview, City Index
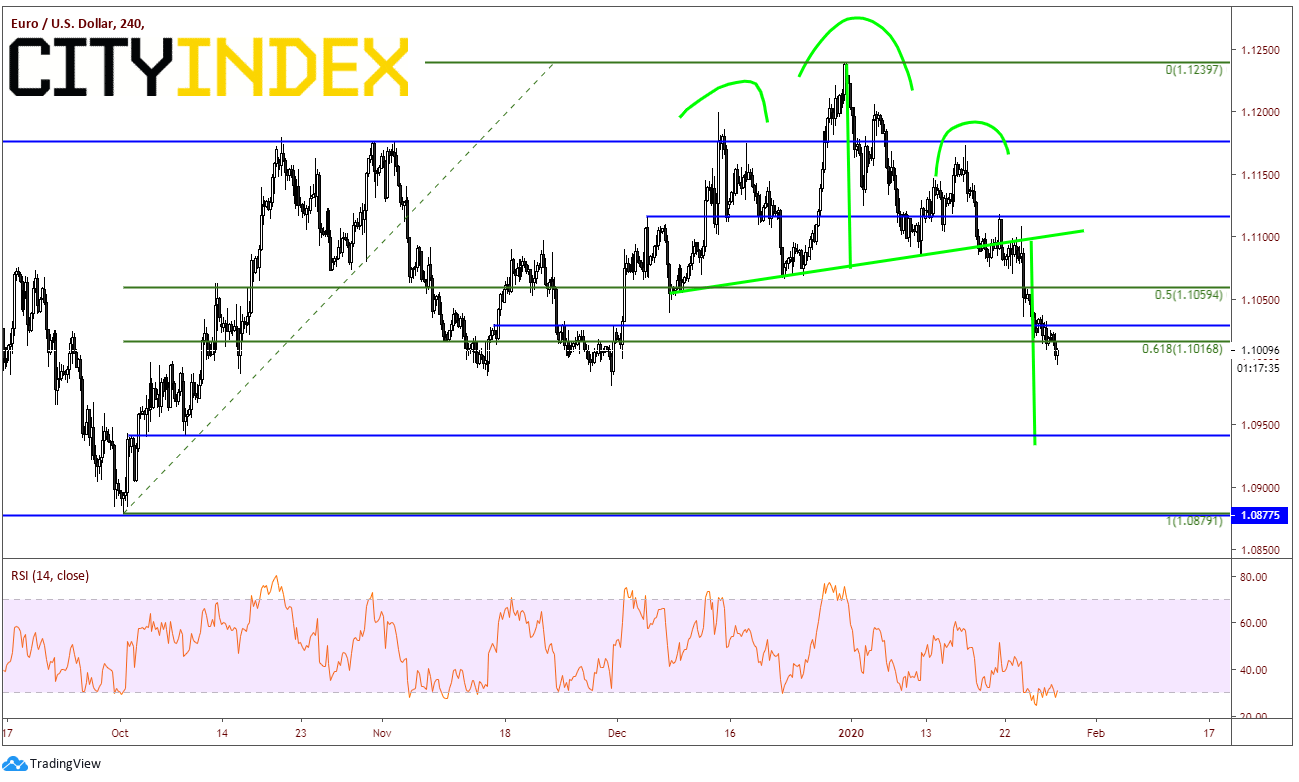
On a 240-minuted chart of the EUR/USD, the downward trend is in full effect. Price has moved lower out of a head and shoulders pattern and has already broken through horizontal support and the 61.8% retracement level from the October 1st lows to the Decmeber31st highs, whereas DXY has not broken through its corresponding levels). In addition, the RSI is oversold and diverging with price, whereas the DXY is not diverging. The target for the head and shoulders pattern is near 1.0935, which is also horizontal support.
Source: Tradingview, City Index
If it turns out to be the case that the EUR/USD is really leading the DXY, one would expect the DXY to push higher through the near term resistance levels.
Since January 1st of this new year, the US Dollar Index (DXY) has been on a one way move higher. The index has been in a long-term channel since mid 2018, and finally broke below it in December, only to be halted at the 50% retracement level from the lows on June 13th , 2018 to the highs on October 1st of last year. More recently, over the last 2 weeks, the DXY has broken through a key inflection point near 97.50/97.75. At this level, price broke through:
- The upper trendline of the downward sloping channel, formed off the October 1st highs.
- The bottom trendline line of the upward slopping channel from 2015
- The 200 Day Moving Average
Source: Tradingview, FOREX.com
On a 240-minuted chart of the DXY, the upward trend is in full effect. However, there is plenty of resistance just above. Price is currently trading near 98.15. There is horizontal resistance near 98.25, as well as the 61.8% retracement level from the October 1st highs to the December 31sr lows near 98.40. (98.50 is the target for the flag pattern which was formed off the lows as well). On addition, the RSI is over 75. Any reading above 70 is worth watching for possible pullbacks in price.
Source: Tradingview, FOREX.com
The Euro makes up almost 58% of the US Dollar index. So, it is no surprise that as the US Dollar Index moves higher, the EUR/USD would move lower. The EUR/USD was in a falling wedge since mid-2018, and on December broke higher out of the wedge. Price halted at the 61.8% retracement level from the highs on June 24th to the lows October 1st and reversed. More recently, over the last 2-week, EUR/USD has broken through a key inflection area near 1.1100. Near this level, price broke through:
- The 200 Day moving average near 1.1135
- The upper trendline of the falling wedge
- The rising trendline off the lows from October 1st
Price is currently at horizontal and psychological support near 1.1000.
Source: Tradingview, FOREX.com
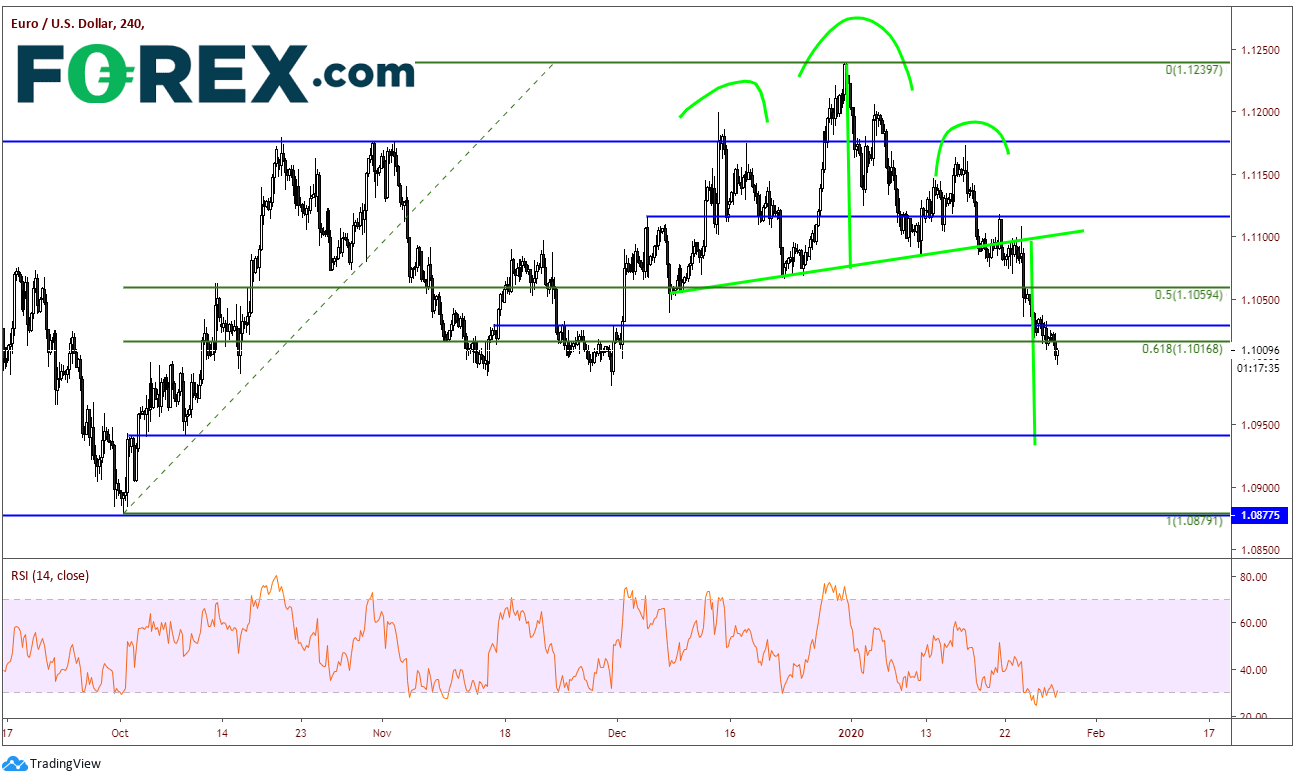
On a 240-minuted chart of the EUR/USD, the downward trend is in full effect. Price has moved lower out of a head and shoulders pattern and has already broken through horizontal support and the 61.8% retracement level from the October 1st lows to the Decmeber31st highs, whereas DXY has not broken through its corresponding levels). In addition, the RSI is oversold and diverging with price, whereas the DXY is not diverging. The target for the head and shoulders pattern is near 1.0935, which is also horizontal support.
Source: Tradingview, FOREX.com
If it turns out to be the case that the EUR/USD is really leading the DXY, one would expect the DXY to push higher through the near term resistance levels.


Open an account in minutes
Experience award-winning platforms with fast and secure execution, and enjoy tight spreads from 0.5 pts on FX and 0.3 pts on indices.
Economic calendar
Web Trader platform
Our sophisticated web-based platform is packed with features.
Related articles

Japanese Yen Forecast: USD/JPY 4% Rally Challenges Post-Intervention Downtrend 9 24 2026
USD/JPY momentum has shifted sharply higher, putting a major resistance confluence in focus as U.S. and Japanese event risk builds.


Oil Quietly Hands the Fed a Reason to Stay Hawkish
Oil prices and the U.S. dollar are both on the front foot as elevated energy costs feed Fed warnings that inflation may prove sticky.


USD/JPY outlook: Hawkish Fed recalibration pressures the yen
Stronger US growth momentum and rising Treasury yields are keeping USD/JPY pointed higher, even as Japanese policymakers try to limit the pressure building across domestic markets.

This report is intended for general circulation only. It should not be construed as a recommendation, or an offer (or solicitation of an offer) to buy or sell any financial products. The information provided does not take into account your specific investment objectives, financial situation or particular needs. Before you act on any recommendation that may be contained in this report, independent advice ought to be sought from a financial adviser regarding the suitability of the investment product, taking into account your specific investment objectives, financial situation or particular needs.
StoneX Financial Pte. Ltd., may distribute reports produced by its respective foreign entities or affiliates within the StoneX group of companies or third parties pursuant to an arrangement under Regulation 32C of the Financial Advisers Regulations. Where the report is distributed to a person in Singapore who is not an accredited investor, expert investor or an institutional investor (as defined in the Securities Futures Act), StoneX Financial Pte. Ltd. accepts legal responsibility to such persons for the contents of the report only to the extent required by law. Singapore recipients should contact StoneX Financial Pte. Ltd. at 6826 9988 for matters arising from, or in connection with the report.
In the case of all other recipients of this report, to the extent permitted by applicable laws and regulations neither StoneX Financial Pte. Ltd. nor its associated companies will be responsible or liable for any loss or damage incurred arising out of, or in connection with, any use of the information contained in this report and all such liability is hereby expressly disclaimed. No representation or warranty is made, express or implied, that the content of this report is complete or accurate.
StoneX Financial Pte. Ltd. is not under any obligation to update this report.
Trading CFDs carries a high level of risk that may not be suitable for some investors. Consider your investment objectives, level of experience, financial resources, risk appetite and other relevant circumstances carefully. The possibility exists that you could lose some or all of your investments, including your initial deposits. If in doubt, please seek independent expert advice. Visit www.forex.com/en-sg/terms-and-policies for the complete Risk Disclosure Statement.