




ftse china a50 weekly outlook 12 oct to 16 oct turning positive for a potential multi week rally 155
<p>(Click to enlarge charts) What happened last week The China A50 Index (proxy for the FTSE China A50) has reopened on 08 October 2015 after […]</p>
Share this:

What happened last week
The China A50 Index (proxy for the FTSE China A50) has reopened on 08 October 2015 after a week-long of holidays to celebrate China’s national day.
Key elements
- Price action has continued to inch higher from the “Black Monday”, 24 August 2015 low of 8045 which confluences closely with a Fibonacci cluster at 8400/8000 (76.4% Fibonacci retracement from 20 March 2014 low to 09 June 2015 high + 1.00 Fibonacci projection from 09 June 2015 high and 10 July 2015 high) (see daily chart).
- The daily (medium-term) RSI oscillator has just broken out of its resistance and the 50% neutrality level which suggests a revival in upside momentum for the Index (see daily chart).
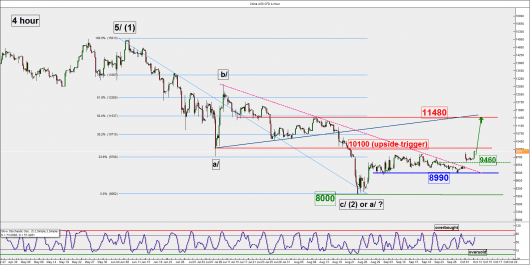
- As the Index continues to push higher, a higher “swing low” can be seen at the 8990 level (see 4 hour chart).
- On the medium-term (1 to 3 weeks), the significant resistance to watch will be at 10100 which was the former support linking the lows on four occasions (19 January, 06 February, 09 March & 08 July 2015) follow by 11480 next (defined by the pull-back resistance, in dark blue & the 50% the steep down move from 09 June 2015 high to 24 August 2015 low) (see daily & 4 hour charts).
- On the longer-term, the Index has formed a bullish “Hammer” candlestick pattern on the week of the “Black Monday”, 24 August 2015 at the 8400 support (see weekly chart).
Key levels (1 to 3 weeks)
Intermediate support: 9460
Pivot (key support): 8990
Resistance: 10100 & 11480
Next support: 8400/8000
Conclusion
Technical elements have started to turn positive for the Index. As long as the 8990 weekly pivotal support holds and a break above the 10100 upside trigger level is likely to add impetus for a further potential rally to target the 11480 resistance.
However, a break below the 8990 pivotal support may invalidate the expected bullish scenario for a slide to retest the range support at 8400/8000.
Source: Charts are from eSignal & City Index Advantage Trader
Disclaimer
This report is intended for general circulation only. It should not be construed as a recommendation, or an offer (or solicitation of an offer) to buy or sell any financial products. The information provided does not take into account your specific investment objectives, financial situation or particular needs. Before you act on any recommendation that may be contained in this email, independent advice ought to be sought from a financial adviser regarding the suitability of the investment product, taking into account your specific investment objectives, financial situation or particular needs. All queries regarding the contents of this material are to be directed to City Index, a trading name of GAIN Capital Singapore Pte Ltd.
Trading CFDs and FX on margin carries a high level of risk that may not be suitable for some investors. Consider your investment objectives, level of experience, financial resources, risk appetite and other relevant circumstances carefully. The possibility exists that you could lose some or all of your investments, including your initial deposits. If in doubt, please seek independent expert advice. Visit cityindex.com.sg for the complete Risk Disclosure Statement.
Related tags:




Open an account in minutes
Experience award-winning platforms with fast and secure execution, and enjoy tight spreads from 0.5 pts on FX and 0.3 pts on indices.
Economic calendar
Web Trader platform
Our sophisticated web-based platform is packed with features.
Related articles
This report is intended for general circulation only. It should not be construed as a recommendation, or an offer (or solicitation of an offer) to buy or sell any financial products. The information provided does not take into account your specific investment objectives, financial situation or particular needs. Before you act on any recommendation that may be contained in this report, independent advice ought to be sought from a financial adviser regarding the suitability of the investment product, taking into account your specific investment objectives, financial situation or particular needs.
StoneX Financial Pte. Ltd., may distribute reports produced by its respective foreign entities or affiliates within the StoneX group of companies or third parties pursuant to an arrangement under Regulation 32C of the Financial Advisers Regulations. Where the report is distributed to a person in Singapore who is not an accredited investor, expert investor or an institutional investor (as defined in the Securities Futures Act), StoneX Financial Pte. Ltd. accepts legal responsibility to such persons for the contents of the report only to the extent required by law. Singapore recipients should contact StoneX Financial Pte. Ltd. at 6826 9988 for matters arising from, or in connection with the report.
In the case of all other recipients of this report, to the extent permitted by applicable laws and regulations neither StoneX Financial Pte. Ltd. nor its associated companies will be responsible or liable for any loss or damage incurred arising out of, or in connection with, any use of the information contained in this report and all such liability is hereby expressly disclaimed. No representation or warranty is made, express or implied, that the content of this report is complete or accurate.
StoneX Financial Pte. Ltd. is not under any obligation to update this report.
Trading CFDs carries a high level of risk that may not be suitable for some investors. Consider your investment objectives, level of experience, financial resources, risk appetite and other relevant circumstances carefully. The possibility exists that you could lose some or all of your investments, including your initial deposits. If in doubt, please seek independent expert advice. Visit www.forex.com/en-sg/terms-and-policies for the complete Risk Disclosure Statement.