



GBP/USD, Oil Outlook: Two Trades to Watch
GBP/USD rises after GDP contracts less than forecast. Oil rises to a 2-month high after US CPI & China oil trade data
Share this:

GBP/USD rises after GDP contracts less than forecast
- UK GDP at -0.1% MoM in May vs -0.3% forecast
- US PPI data due after CPI cools to 3%
- GBP/USD hits a 15-month high, but is in overbought territory
GBP/USD trades around a 15-month high above 1.30 after the UK economy held up better than expected in May and as investors continue to digest cooler can expected US CPI data.
Data today showed that UK economy shrank by -0.1% MoM in May, against estimates of a -0.3% contraction. This was also a slight improvement on the -0.2% contraction in April.
While the figures were better than expected, the overall picture is fairly downbeat, with no growth in the 3 months to May.
The data comes after data earlier in the week showed record wage growth at 7.3%, which fueled bets that the BoE will continue hiking interest rates aggressively.
This is in contrast to the Federal Reserve, with the market increasingly convinced that the US central bank will hike just once more, in July.
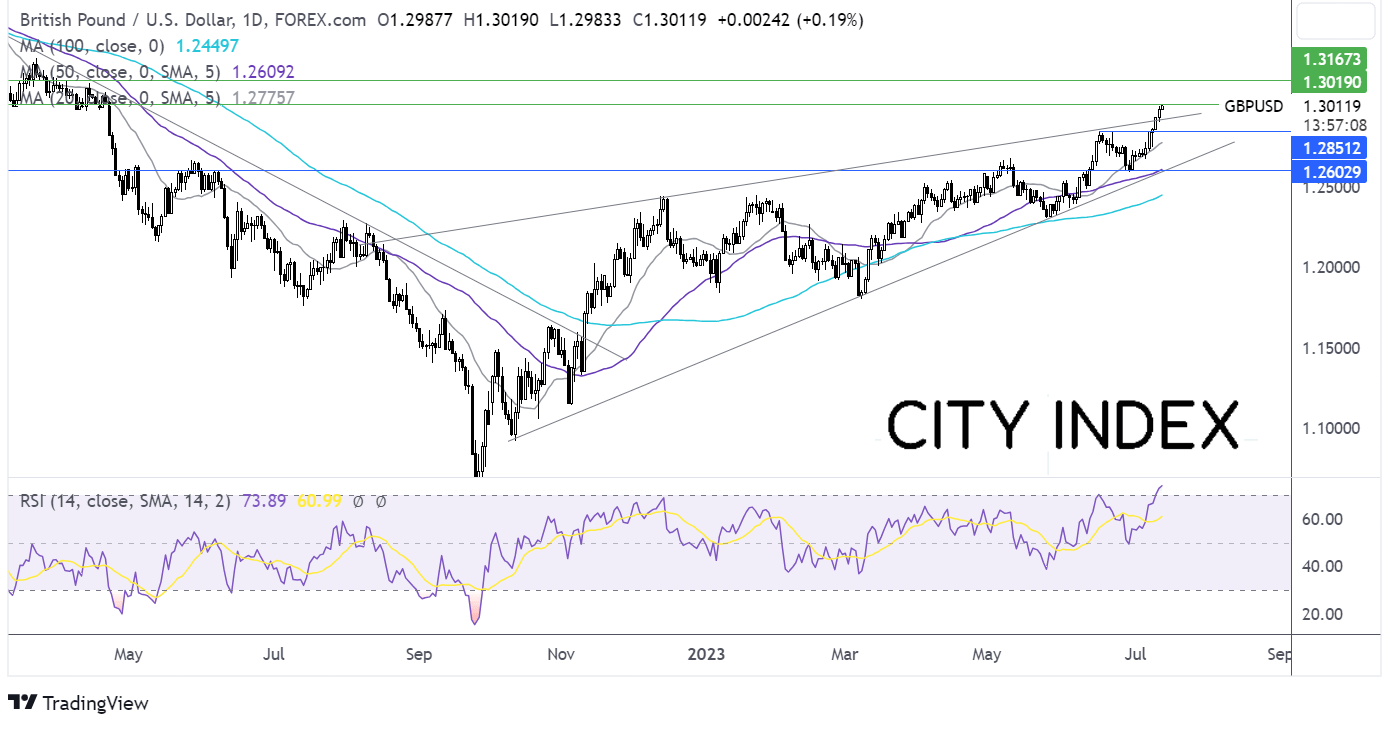
The central bank divergence has boosted GBP/USD, lifting it to 1.3019 its highest level since April 2022, the rally is losing momentum.
While hawkish BoE bets and a weaker USD support the pair, gains are being limited by concerns that the UK economy could be heading for a recession. Given the lag time between rate hikes and the impact on the economy, there are concerns that the contraction in April and May could be the start of a prolonged slowdown. As a result, the pound may struggle to push much higher.
GBP/USD outlook – technical outlook
GBP/USD broke out above the rising trendline dating back to August last year, rising above 1.30 to a 15-month high of 1.3019. The RSI is in overbought territory so buyers should be cautious.
A ruse above 1.3019 opens the door to 1.31 round number, and 1.3170, the April 2022 high.
On the downside, support can be seen at 1.2930, the rising trendline support, and 1.2850, the June high, before exposing the 20 sma at 1.2775.

Oil rises to a 2-month high after US CPI & China oil trade data
- Oil rises after softer US CPI & strong China oil import data
- EIA stockpiles rise to 6 million barrels
- Oil rises above 75.00 resistance
Oil prices are rising again on Thursday after US inflation data fueled hopes that the Federal Reserve hiking cycle could be drawing to an end and after Chinese trade data showed that monthly oil imports were the second highest on record in June.
U.S. data yesterday showed that consumer prices cooled by more than expected, marking the smallest increase in inflation in over two years. As a result, the markets now expect just one more rate hike from the Fed before it concludes its rate-hiking cycle, supporting the demand outlook. Given that rate hikes slow economic growth, the end of a rate hiking cycle is considered a positive for the oil demand outlook.
Meanwhile, China's crude imports in June rose to 52.06 million metric tonnes, which equates to 12.67 million barrels per day. A 45% increase in crude imports annually and the second-highest monthly figure on record is helping to soothe fears over slowing momentum in the Chinese economic recovery.
However, gains could be capped as slow global economic growth saw China record its largest decline in exports in 3 years. Exports plunged 12.4% in June from a year earlier, a much larger drop than the 9.5% forecast. Imports also declined 6.8% YoY in June, worse than the 4% decline forecast.
A larger-than-expected build in US crude oil stockpiles, of nearly 6 million barrels last week could prevent oil prices from rising much further.
Oil outlook – technical analysis
Oil has risen above the multi-week falling trendline, the 20, 50 & 100 sma, and resistance at 75.00. The 20 sma is crossing above the 50 sma in a bullish signal, and the RSI supports further gains while remaining out of the overbought territory.
Buyers will look to resistance at 77.00, the multi-month falling trendline. A rise above here could bring 79.00, the April 25 high, into play ahead of 83.40, the April high.
On the flip side, support can be seen at 75.000, the June high, with a break below here exposing the 73.55, the 100 sma ahead of 71.40, the confluence the of 20 & 50 sma. A break of 67.00 is needed to create a lower low.


Related tags:




Open an account in minutes
Experience award-winning platforms with fast and secure execution, and enjoy tight spreads from 0.5 pts on FX and 0.3 pts on indices.
Economic calendar
Web Trader platform
Our sophisticated web-based platform is packed with features.
Related articles

British Pound Technical Outlook: GBP/USD Rebound Challenges September Downtrend 9 30 2026
Sterling has rallied sharply from key support, with GBP/USD at an inflection point that could determine whether a larger recovery is underway.


GBP/USD, Oil Forecast: Two trades to watch 300926
GBP/USD: Can Stronger UK Growth Offset the Dollar’s Advantage? Oil: Supply Recovery Challenges the Geopolitical Premium.
GBP/USD Q4 Outlook: Can the Pound Turn the Tide Against a Hawkish Fed?
GBP/USD hovers around a 3-month low. Can the pound turn the tide against a hawkish Fed or will widening policy divergence keep GBP/USD under pressure in Q4?
This report is intended for general circulation only. It should not be construed as a recommendation, or an offer (or solicitation of an offer) to buy or sell any financial products. The information provided does not take into account your specific investment objectives, financial situation or particular needs. Before you act on any recommendation that may be contained in this report, independent advice ought to be sought from a financial adviser regarding the suitability of the investment product, taking into account your specific investment objectives, financial situation or particular needs.
StoneX Financial Pte. Ltd., may distribute reports produced by its respective foreign entities or affiliates within the StoneX group of companies or third parties pursuant to an arrangement under Regulation 32C of the Financial Advisers Regulations. Where the report is distributed to a person in Singapore who is not an accredited investor, expert investor or an institutional investor (as defined in the Securities Futures Act), StoneX Financial Pte. Ltd. accepts legal responsibility to such persons for the contents of the report only to the extent required by law. Singapore recipients should contact StoneX Financial Pte. Ltd. at 6826 9988 for matters arising from, or in connection with the report.
In the case of all other recipients of this report, to the extent permitted by applicable laws and regulations neither StoneX Financial Pte. Ltd. nor its associated companies will be responsible or liable for any loss or damage incurred arising out of, or in connection with, any use of the information contained in this report and all such liability is hereby expressly disclaimed. No representation or warranty is made, express or implied, that the content of this report is complete or accurate.
StoneX Financial Pte. Ltd. is not under any obligation to update this report.
Trading CFDs carries a high level of risk that may not be suitable for some investors. Consider your investment objectives, level of experience, financial resources, risk appetite and other relevant circumstances carefully. The possibility exists that you could lose some or all of your investments, including your initial deposits. If in doubt, please seek independent expert advice. Visit www.forex.com/en-sg/terms-and-policies for the complete Risk Disclosure Statement.