



Gold Bounces Within Range After Post-FOMC Dollar Selloff
Gold rebounded after the Fed triggered a sharp US dollar selloff, but technical resistance and a crowded dollar trade suggest caution remains.
Share this:

Gold rebounded after the Federal Reserve prompted a sharp selloff in the US dollar, but the bigger question is whether that weakness has further to run. With the US Dollar Index approaching a major technical level and gold testing resistance, the next move for both markets may hinge on incoming US economic data.
View related analysis:
View related analysis:
Post-FOMC Dollar Weakness Lifts Gold Within Its Trading Range
The slightly less hawkish than expected FOMC meeting resulted in the US dollar suffering its worst day in three months. While Fed funds futures still imply a 25-bp hike in September, expectations for a follow-up hike have been pushed back from December to March. The fact that three FOMC members voted for a hike at yesterday's meeting has done little to alter expectations beyond September, allowing the weaker US dollar to lift gold and WTI crude.
But with Kevin Warsh vowing to keep fighting inflation, the Fed may be forced to deliver another hawkish hike next month if employment data holds up and inflation reaccelerates—which it might, given the recent rally in crude oil prices driven by Middle East headlines.
This raises the question of how much further the US Dollar Index (DXY) can fall. The answer could prove pivotal for gold, as the extent of any further dollar weakness is likely to determine how far the current rebound can extend.


US Dollar Index (DXY) Technical Analysis
Crowded Dollar Longs Face Their First Test
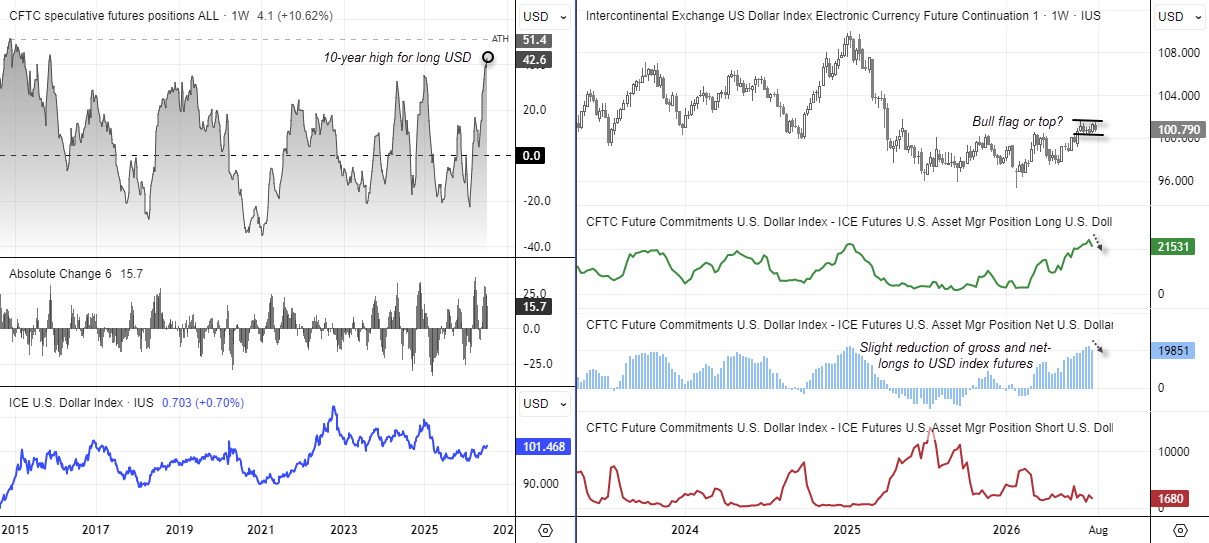
I have questioned in recent weeks whether the US dollar was nearing a sentiment extreme in the futures market. Net-long exposure rose to a 10-year high of $42.6 billion, according to the latest COT report data. Asset managers also reduced gross longs in US Dollar Index futures, with net-long exposure retreating from last week's 18-month high.
While futures positioning points to a sentiment extreme, I suspect any pullback in the US dollar will be limited unless the economic data begin to roll over.
The weekly US Dollar Index chart shows a potential bull flag, which could allow for a modest pullback before a bullish breakout. However, if the index falls below 100, I would consider the bull flag invalidated, suggesting a deeper correction is underway.
Source: ICE, TradingView
100 Becomes the Line in the Sand
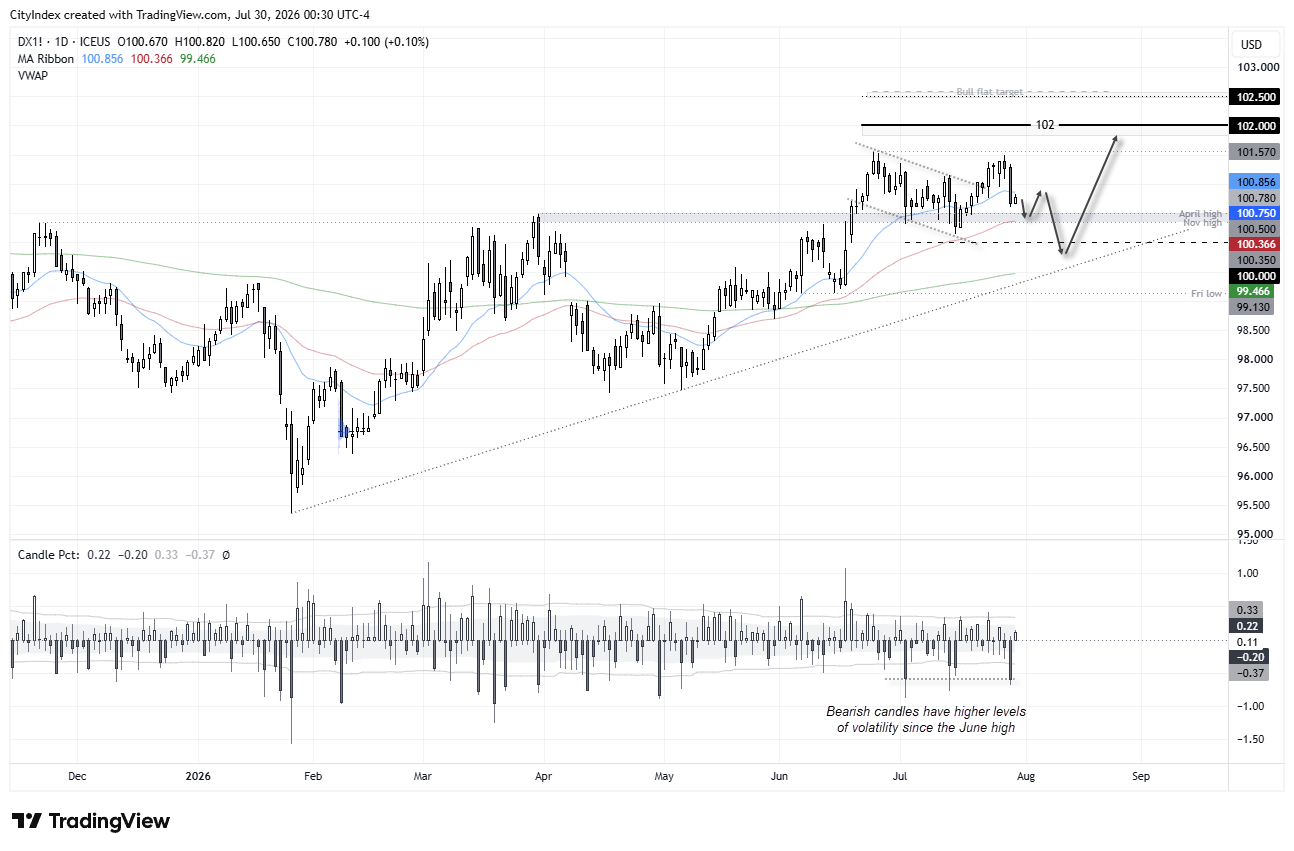
The daily chart shows bearish momentum has accelerated on the US Dollar Index after a double top formed around the June high. I suspect dollar bears are targeting a retest—and potentially a break—of the 100 level. However, the April and November highs could provide support, with a break below the 50-day EMA increasing the odds of a move towards 100. That could provide further support for gold in the near term, although I remain sceptical that we're about to witness a runaway rally.
Ultimately, my bias for a move to 102 remains intact while prices hold above 100. A break below 100 would bring the 200-day EMA and January's bullish trendline into focus.
Source: ICE, TradingView
Gold Futures (GC) Technical Analysis
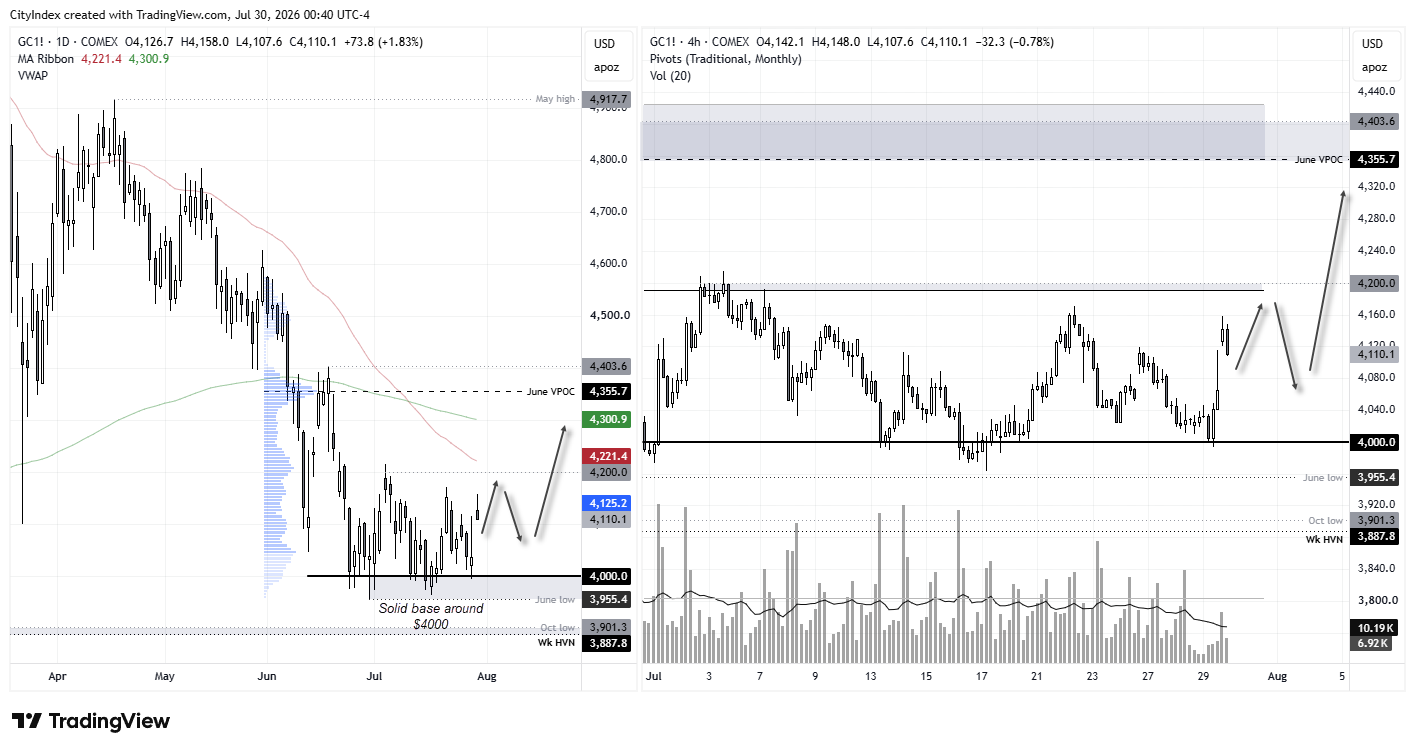
While gold remains within a downtrend, seasonality tends to favour the bulls as we head into August. We can see on the daily chart that $4,000 has provided solid support, with prices gapping $2.20 higher at today's open following the Fed-induced weakness in the US dollar.
Prices have since retraced part of that opening gap, but the rebound highlights the potential for a move back towards the cycle highs around $4,200. Such a move could coincide with the US Dollar Index extending its pullback towards the 50-day EMA, although it would also increase the risk of a deeper correction from those highs.
With my bias favouring the DXY falling towards 100, I am also on guard for a breakout above $4,200, given the strength of the rebound from support.
Source: ICE, TradingView
View the full economic calendar
View the full economic calendar
-- Written by Matt Simpson
Follow Matt on Twitter @cLeverEdge
How to trade with City Index
You can trade with City Index by following these four easy steps:
- Open an account, or log in if you’re already a customer
• Open an account in the UK
• Open an account in Australia
• Open an account in Singapore
- Search for the market you want to trade in our award-winning platform
- Choose your position and size, and your stop and limit levels
- Place the trade
Related tags:

Open an account in minutes
Experience award-winning platforms with fast and secure execution, and enjoy tight spreads from 0.5 pts on FX and 0.3 pts on indices.
Economic calendar
Web Trader platform
Our sophisticated web-based platform is packed with features.
Related articles

Gold forecast: XAU/USD could take a larger dive after the big rise in yields
Gold prices have been falling in the last few days after last week’s post-FOMC pop faded amid rising interest rate expectations, higher oil prices and a strengthening US dollar. As before, I wasn’t convinced gold would thrive in the current macro backdrop.


WTI Crude Oil Mulls Bounce from $90
Having fallen 17% from its cycle highs in just five days and now holding above $90, perhaps it could be time for crude oil to bounce over the near term.

Gold, silver slammed as hawkish Fed repricing reignites dollar upside
Gold and silver had held up surprisingly well against surging US yields. Wednesday’s DXY breakout may have changed that equation.

This report is intended for general circulation only. It should not be construed as a recommendation, or an offer (or solicitation of an offer) to buy or sell any financial products. The information provided does not take into account your specific investment objectives, financial situation or particular needs. Before you act on any recommendation that may be contained in this report, independent advice ought to be sought from a financial adviser regarding the suitability of the investment product, taking into account your specific investment objectives, financial situation or particular needs.
StoneX Financial Pte. Ltd., may distribute reports produced by its respective foreign entities or affiliates within the StoneX group of companies or third parties pursuant to an arrangement under Regulation 32C of the Financial Advisers Regulations. Where the report is distributed to a person in Singapore who is not an accredited investor, expert investor or an institutional investor (as defined in the Securities Futures Act), StoneX Financial Pte. Ltd. accepts legal responsibility to such persons for the contents of the report only to the extent required by law. Singapore recipients should contact StoneX Financial Pte. Ltd. at 6826 9988 for matters arising from, or in connection with the report.
In the case of all other recipients of this report, to the extent permitted by applicable laws and regulations neither StoneX Financial Pte. Ltd. nor its associated companies will be responsible or liable for any loss or damage incurred arising out of, or in connection with, any use of the information contained in this report and all such liability is hereby expressly disclaimed. No representation or warranty is made, express or implied, that the content of this report is complete or accurate.
StoneX Financial Pte. Ltd. is not under any obligation to update this report.
Trading CFDs carries a high level of risk that may not be suitable for some investors. Consider your investment objectives, level of experience, financial resources, risk appetite and other relevant circumstances carefully. The possibility exists that you could lose some or all of your investments, including your initial deposits. If in doubt, please seek independent expert advice. Visit www.forex.com/en-sg/terms-and-policies for the complete Risk Disclosure Statement.