





Gold forecast: tariff reprieve tempers bull run but pullback may be shallow
The longer-term positive gold forecast amid robust safe-haven demand remains intact, even as prices wobble slightly at the start of the week. But in the near-term gold is once again looking a touch stretched and a period of consolidation may be warranted, although that doesn’t necessarily spell the end of its rally.
Share this:

- Gold forecast remains bullish, but near-term pullback risks are rising
- Temporary tariff exemptions spur brief risk appetite
- Technical indicators suggest gold is nearing overbought territory
Gold has started the week on the backfoot after another impressive leap of 6.5% last week, as the Trump administration’s erratic trade manoeuvres rattled confidence, causing investors to seek refuge in the yellow metal. The latest twist? A reprieve on tariffs for select Chinese-made tech products, including consumer favourites like smartphones. Markets initially welcomed the move, with risk assets staging a modest recovery. However, President Trump swiftly reminded markets that “no one is getting off the hook for unfair trade balances,” a statement that has so far not cooled the optimism too much. The longer-term positive gold forecast amid robust safe-haven demand remains intact, even as prices wobble slightly at the start of the week. But in the near-term gold is once again looking a touch stretched and a period of consolidation may be warranted, although that doesn’t necessarily spell the end of its rally.
Tariff tweaks offer respite—but for how long?
Washington’s partial retreat from its hard-line tariff regime—specifically the temporary exemption of a raft of tech goods from punitive import levies—has momentarily eased fears of an all-out trade war. The current iteration of the tariffs slaps a 125% China-specific surcharge on certain electronics, with a broader 10% flat rate globally. Yet, Trump’s latest remarks on Sunday hinted at pragmatism: “You have to show a certain flexibility. Nobody should be so rigid.”
Encouraging words, perhaps—but actions will speak louder. With another update on semiconductor tariffs due imminently, markets remain wary. China has called for a complete rollback of the duties—an unlikely outcome. Unless a broader trade accord is struck soon, the stalemate could continue to hold back risk appetite. While this softening of tone may appear constructive on the surface, it doesn’t meaningfully shift the dial unless accompanied by substantive progress in US-China trade relations.
What now for gold?
For gold investors, the strategy of choice has been simple: buy the dips and hold steady. And thus far, it’s worked a treat. But with prices already orbiting record highs and at extreme overbought levels, one must ask—how much higher can this go before gravity kicks in?
A genuine improvement in risk sentiment—say, on the back of a breakthrough in trade negotiations—could bring about a short-term pause in the gold rally. That said, the metal’s long-term trajectory remains upward unless we witness a material shift in global macro conditions.
Technical gold forecast: RSI reaches overbought again
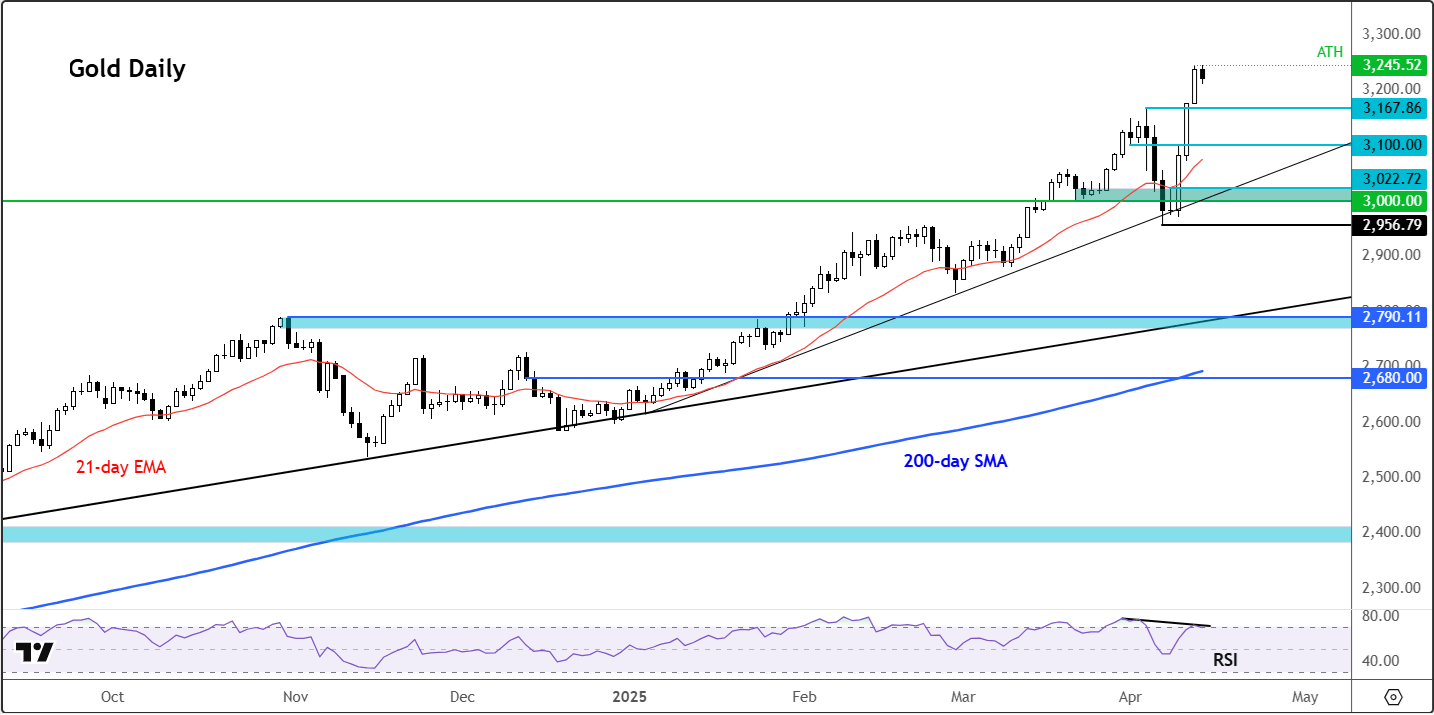
Technically speaking, gold’s uptrend remains firmly intact. The latest surge has pushed the Relative Strength Index (RSI) on the daily chart back up to the 70.0 mark—often seen as a sign of overbought conditions. This in itself doesn’t constitute a sell signal, but it does warrant caution, particularly as broader timeframes flash similar warnings.
Source: TradingView.com
The monthly RSI, for example, has held above the overbought threshold since April 2024 and is now approaching 85—a level that, historically, tends to precede either lengthy consolidations or more pronounced corrections in the underlying price of gold. We saw this in October last year, and even further back during the pandemic highs and the 2011 peak.
The weekly RSI, meanwhile, is nudging 75. Though not quite at extremes, it's certainly elevated. Add to that the fact that gold is trading nearly $1,100 above its 200-week moving average—roughly 55% above its long-term mean—and you have a picture of a market potentially overextended.
Still, the bullish trend remains unbroken. Until we see clear evidence of lower highs and lower lows, the path of least resistance remains upwards, keeping the technical gold forecast bullish. Any pullback to short-term support zones may well be seen as another buying opportunity.
Key levels to watch
Support now rests initially at $3,167—last week’s high. A deeper dip could test the $3,100 level, and below that, the $3,000 to $3,022 range, where trendline support and psychological round numbers converge.
The line in the sand for me is at $2,956. A break below this could trigger a larger retracement, possibly down to the $2,790 area—home to longer-term support trend.
In summary, this gold forecast remains bullish, though tempered by technical signals suggesting we may be due a pause or pullback. The broader macro backdrop continues to favour gold, but after such a sharp run, a bit of consolidation wouldn’t be out of order.
-- Written by Fawad Razaqzada, Market Analyst
Follow Fawad on Twitter @Trader_F_R
How to trade with City Index
You can trade with City Index by following these four easy steps:
- Open an account, or log in if you’re already a customer
• Open an account in the UK
• Open an account in Australia
• Open an account in Singapore
- Search for the company you want to trade in our award-winning platform
- Choose your position and size, and your stop and limit levels
- Place the trade
Related tags:
Latest market news




Open an account in minutes
Experience award-winning platforms with fast and secure execution, and enjoy tight spreads from 0.5 pts on FX and 0.3 pts on indices.
Economic calendar
Web Trader platform
Our sophisticated web-based platform is packed with features.
Related articles
Gold Forecast: Are Bears Regaining Control of XAU/USD?
The start of the trading week has not been particularly favorable for gold. This can be seen in recent XAU/USD price action, with the metal falling nearly 4.00% over the last two trading sessions and bringing renewed attention to a bearish bias within the market.


AUD/USD outlook: Aussie slips despite hawkish RBA ahead of key data
The AUD/USD was unable to benefit from the Reserve Bank of Australia’s 25-basis-point rate hike overnight. The RBA lifted the cash rate to 4.60%, in line with expectations. However, the Australian dollar weakened following the decision, with much of the Bank’s hawkish stance seemingly priced in ahead of the announcement. The US dollar has also remained largely supported following the recent turmoil in the bond markets.

RBA delivers 25bp hike, Bullock now the main event
The RBA delivered the expected 25bp hike, but Bullock’s press conference now looms as the bigger volatility risk for AUD/USD and the ASX 200.

This report is intended for general circulation only. It should not be construed as a recommendation, or an offer (or solicitation of an offer) to buy or sell any financial products. The information provided does not take into account your specific investment objectives, financial situation or particular needs. Before you act on any recommendation that may be contained in this report, independent advice ought to be sought from a financial adviser regarding the suitability of the investment product, taking into account your specific investment objectives, financial situation or particular needs.
StoneX Financial Pte. Ltd., may distribute reports produced by its respective foreign entities or affiliates within the StoneX group of companies or third parties pursuant to an arrangement under Regulation 32C of the Financial Advisers Regulations. Where the report is distributed to a person in Singapore who is not an accredited investor, expert investor or an institutional investor (as defined in the Securities Futures Act), StoneX Financial Pte. Ltd. accepts legal responsibility to such persons for the contents of the report only to the extent required by law. Singapore recipients should contact StoneX Financial Pte. Ltd. at 6826 9988 for matters arising from, or in connection with the report.
In the case of all other recipients of this report, to the extent permitted by applicable laws and regulations neither StoneX Financial Pte. Ltd. nor its associated companies will be responsible or liable for any loss or damage incurred arising out of, or in connection with, any use of the information contained in this report and all such liability is hereby expressly disclaimed. No representation or warranty is made, express or implied, that the content of this report is complete or accurate.
StoneX Financial Pte. Ltd. is not under any obligation to update this report.
Trading CFDs carries a high level of risk that may not be suitable for some investors. Consider your investment objectives, level of experience, financial resources, risk appetite and other relevant circumstances carefully. The possibility exists that you could lose some or all of your investments, including your initial deposits. If in doubt, please seek independent expert advice. Visit www.forex.com/en-sg/terms-and-policies for the complete Risk Disclosure Statement.