



Gold Snapback Grasps for Support at $4800, ST Descending Triangle Builds
Gold started the week with a hard spill and while recovery did follow, bulls haven’t been able to maintain trends above the $5k psychological level, setting up for an interesting finish to the week.
Share this:

Gold Talking Points:
- Gold had gotten to extreme overbought levels last week on a variety of timelines and the snapback move last Friday kept through the weekly open.
- Bulls responded in a big way with support at $4500 and then higher-low support at $4600. Since then, there’s been a tendency for swings to adhere to major psychological levels and that helps to define structure as we move into Friday trade.
- From shorter-term charts there’s a descending triangle with support at $4800 which can be negated by a break of $4941.

Gold pushed a historic run through last week’s trade and the metal finally found sellers right at the $5600 psychological level.
That led to a dip down to $5100 as buyers returned for a perceived value, but the bounce was short-lived, and longs that had ridden the wave-higher used it to take profits before the $5500 level could come back into play. That led to a brutal Friday as gold posted a historic loss with prices dipping all the way down to the $4700 level before a bounce showed into the weekly close.
The pain continued through the Sunday open, and gold again slid aggressively as profit taking from buyers dominated the flow, leading to a test below the $4500 level.
Since then, however, bulls have been making a mark and there was a series of higher-highs and lows that built from that splashdown open on Sunday night. Yesterday saw prices cross back above the major psychological level of $5k, and this is where buyers began to stumble, and at this point, there’s now a bearish short-term formation in the shape of a descending triangle.
Gold Hourly Chart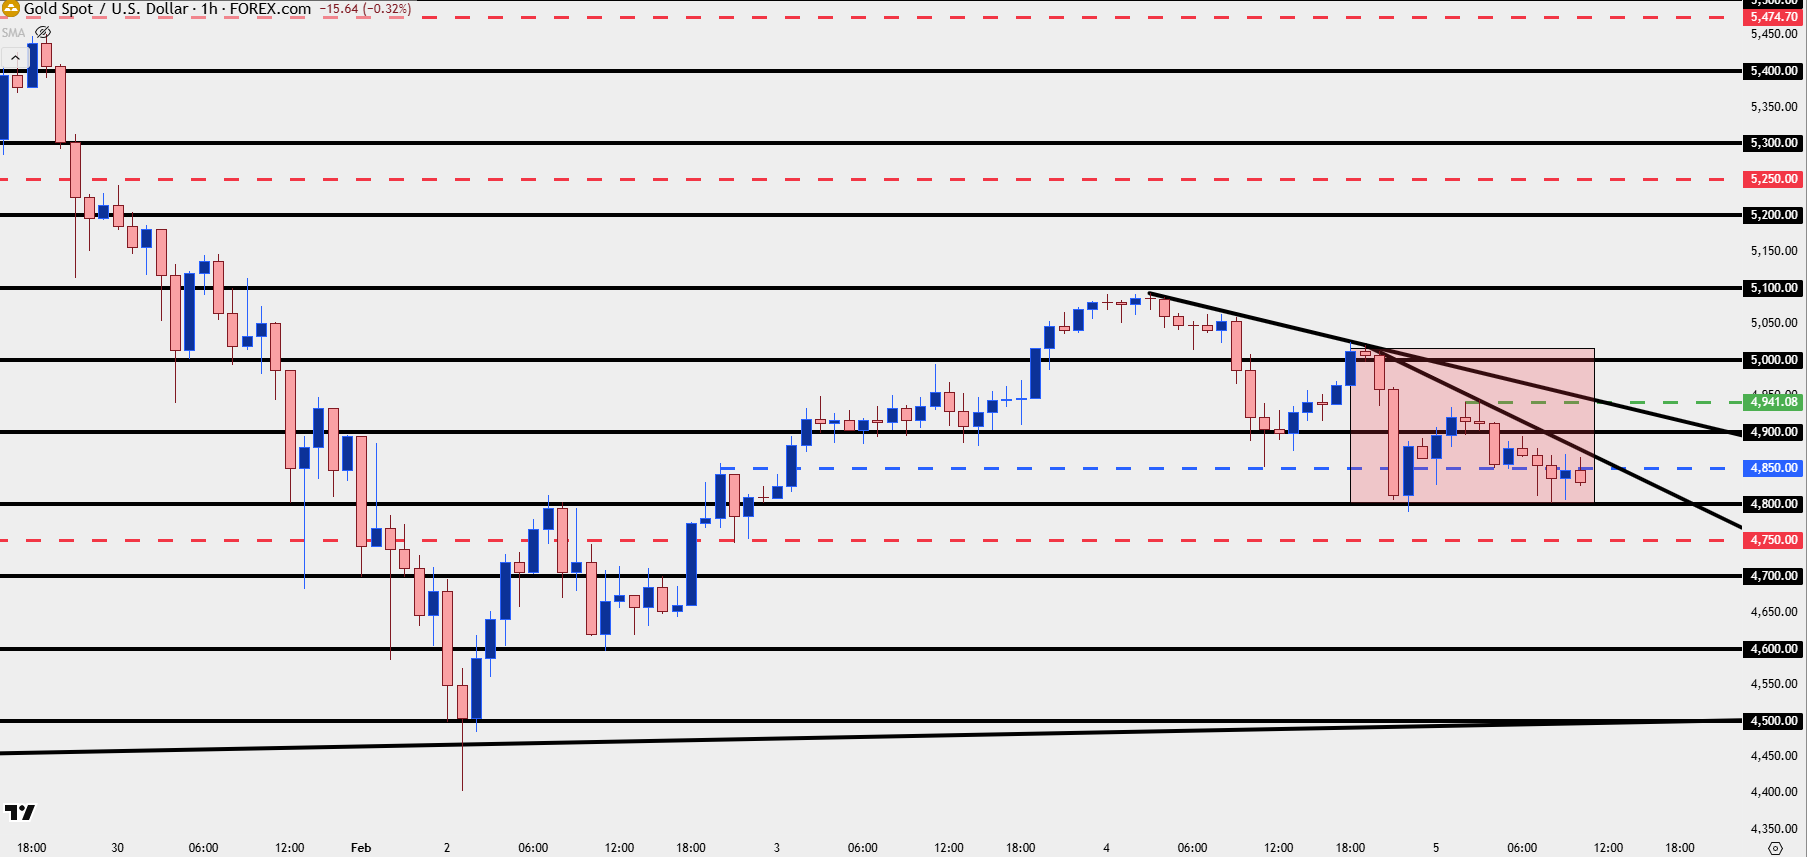
Chart prepared by James Stanley; data derived from Tradingview
Gold Scenario Plotting
At this point there can be an argument on either side of gold, as the shorter-term bearish formation above runs counter to the aggressive bullish trend that drove into last week. To be sure, this can justify a larger pullback in that broader bullish trend but the reality is many of the same reasons that drove the trend-higher into last week remain true today.
If we do want to pick on fundamentals perhaps the item that does stand out was the defense of the US Dollar from both US Treasury Secretary Scott Bessent and Director of the National Economic Council, Kevin Hassett. Strength in the US Dollar and weakness in gold seemed to track those comments from last week and justifiably seeing US officials talk up the benefits of a strong Dollar can be reason for that runaway trend in gold to at least take a pause on the basis of profit taking.
The bigger question is whether it will compel even more profit taking to show or whether buyers will use this pullback as opportunity to add more exposure. Because, after all, it was just a little over a week ago that buyers were hitting the bid aggressively at $5300 or $5400 and now, a week later, they have opportunity to pick up gold at below $5k an ounce. So, a valid case on either side, in my opinion.
For forming strategy, however, that kind of fundamental hedging does little to help; and instead, this is where technicals and structure can come into play. At this point gold as largely adhered to psychological levels and currently it’s the $4800 level that’s setting support for the descending triangle looked at above. Previously, the $4900 level set support ahead of the $5k re-test, and it was above that major psychological level that buyers ultimately faltered.
So, at this point, I want to stick with the structure that’s held so far and this puts focus on the $4600 and $4500 levels that were in-play earlier this week for downside scenarios. The $4700 level would also be of interest, as a drop down to that price followed by a return of buyers could justify a higher-low above the previous higher-low structure from earlier in the week. For topside setups, a break of $4941 will negate the descending triangle and that points to re-test of the $5k level, after which $5100 becomes the next big spot – and a break of that amounts to a short-term higher-high which would further open the door for bulls to make a mark.
Gold Four-Hour Price Chart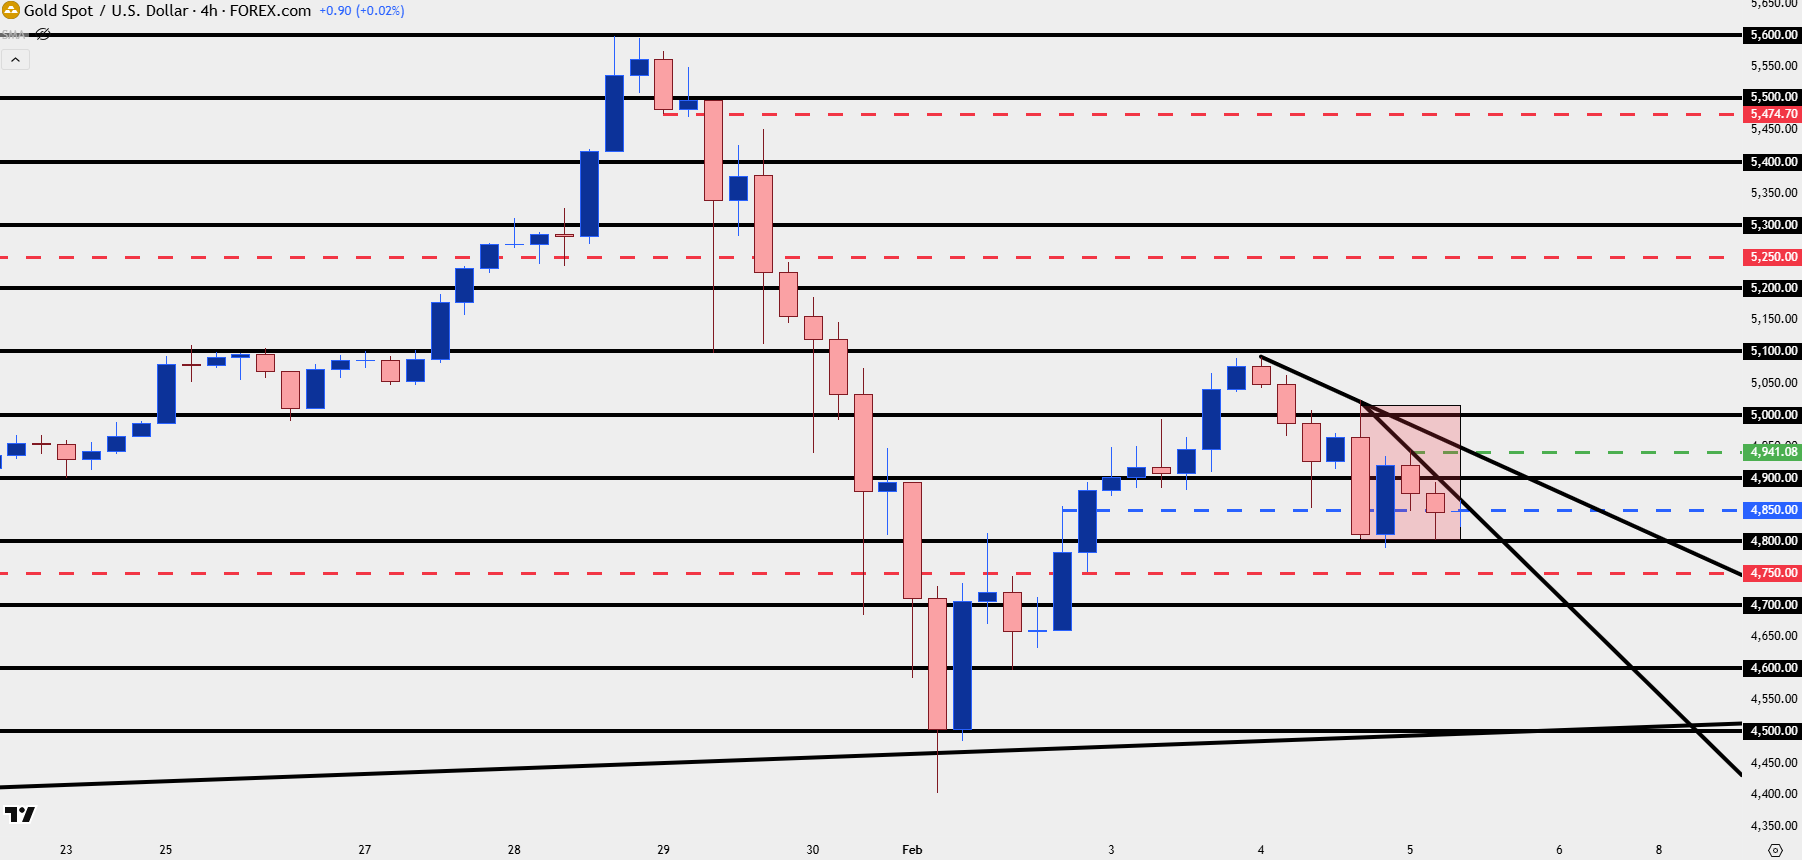
Chart prepared by James Stanley; data derived from Tradingview
--- written by James Stanley, Senior Market Analyst, Global Macro
Related tags:
Latest market news




Open an account in minutes
Experience award-winning platforms with fast and secure execution, and enjoy tight spreads from 0.5 pts on FX and 0.3 pts on indices.
Economic calendar
Web Trader platform
Our sophisticated web-based platform is packed with features.
Related articles
Gold outlook: XAU/USD hammered, stretched and vulnerable to a sharp rebound
Gold is getting hammered for solid fundamental reasons, but history suggests extreme four-hourly oversold conditions can produce violent countertrend rallies.
Gold forecast: Rising yields become too hot for gold, but the outlook is far from bearish
Gold and silver prices took a plunge today, with the former down 3% and the latter falling some 5% by mid European session, before bouncing off their lows. The losses come after the metals remained largely supported until last week, despite the big dollar rally and surging bond yields as we have seen in recent weeks. But it simply got too much, and the metals succumbed to pressure today.


USD into a Massive Week as Yields Fly and Gold Breaks
It’s a huge week with PCE and NFP, but it’s what’s happening off of the calendar that demands attention with US yields flying to fresh multi-decade highs.
This report is intended for general circulation only. It should not be construed as a recommendation, or an offer (or solicitation of an offer) to buy or sell any financial products. The information provided does not take into account your specific investment objectives, financial situation or particular needs. Before you act on any recommendation that may be contained in this report, independent advice ought to be sought from a financial adviser regarding the suitability of the investment product, taking into account your specific investment objectives, financial situation or particular needs.
StoneX Financial Pte. Ltd., may distribute reports produced by its respective foreign entities or affiliates within the StoneX group of companies or third parties pursuant to an arrangement under Regulation 32C of the Financial Advisers Regulations. Where the report is distributed to a person in Singapore who is not an accredited investor, expert investor or an institutional investor (as defined in the Securities Futures Act), StoneX Financial Pte. Ltd. accepts legal responsibility to such persons for the contents of the report only to the extent required by law. Singapore recipients should contact StoneX Financial Pte. Ltd. at 6826 9988 for matters arising from, or in connection with the report.
In the case of all other recipients of this report, to the extent permitted by applicable laws and regulations neither StoneX Financial Pte. Ltd. nor its associated companies will be responsible or liable for any loss or damage incurred arising out of, or in connection with, any use of the information contained in this report and all such liability is hereby expressly disclaimed. No representation or warranty is made, express or implied, that the content of this report is complete or accurate.
StoneX Financial Pte. Ltd. is not under any obligation to update this report.
Trading CFDs carries a high level of risk that may not be suitable for some investors. Consider your investment objectives, level of experience, financial resources, risk appetite and other relevant circumstances carefully. The possibility exists that you could lose some or all of your investments, including your initial deposits. If in doubt, please seek independent expert advice. Visit www.forex.com/en-sg/terms-and-policies for the complete Risk Disclosure Statement.