

USD Bounce
In last week’s webinar the Dollar had pushed lower after President Trump was asked what he though about the US Dollar weakness, to which he responded, ‘it’s great.’ USD flushed lower and EUR/USD jumped above the 1.2000 level but as we looked at last Tuesday, those were both difficult moves to chase.
It was what happened a day later that remains of interest as US Treasury Secretary Scott Bessent offered some comments ahead of the FOMC meeting that helped to bring the USD back to life, and then on Friday some comments from Kevin Hassett made it sound as if the administration wanted to walk back that prior cheering for USD-weakness from President Trump.
This has further allowed for USD recovery and now all those Dollar bears from last week have a chance to sell a pullback with price near a couple points of prior support.
For USD-weakness, I still favor GBP/USD and there’s been a clean support test there. EUR/USD is of interest, to a lesser degree. And for USD-strength, I’m still tracking USD/JPY and USD/CAD.
US Dollar Daily Price Chart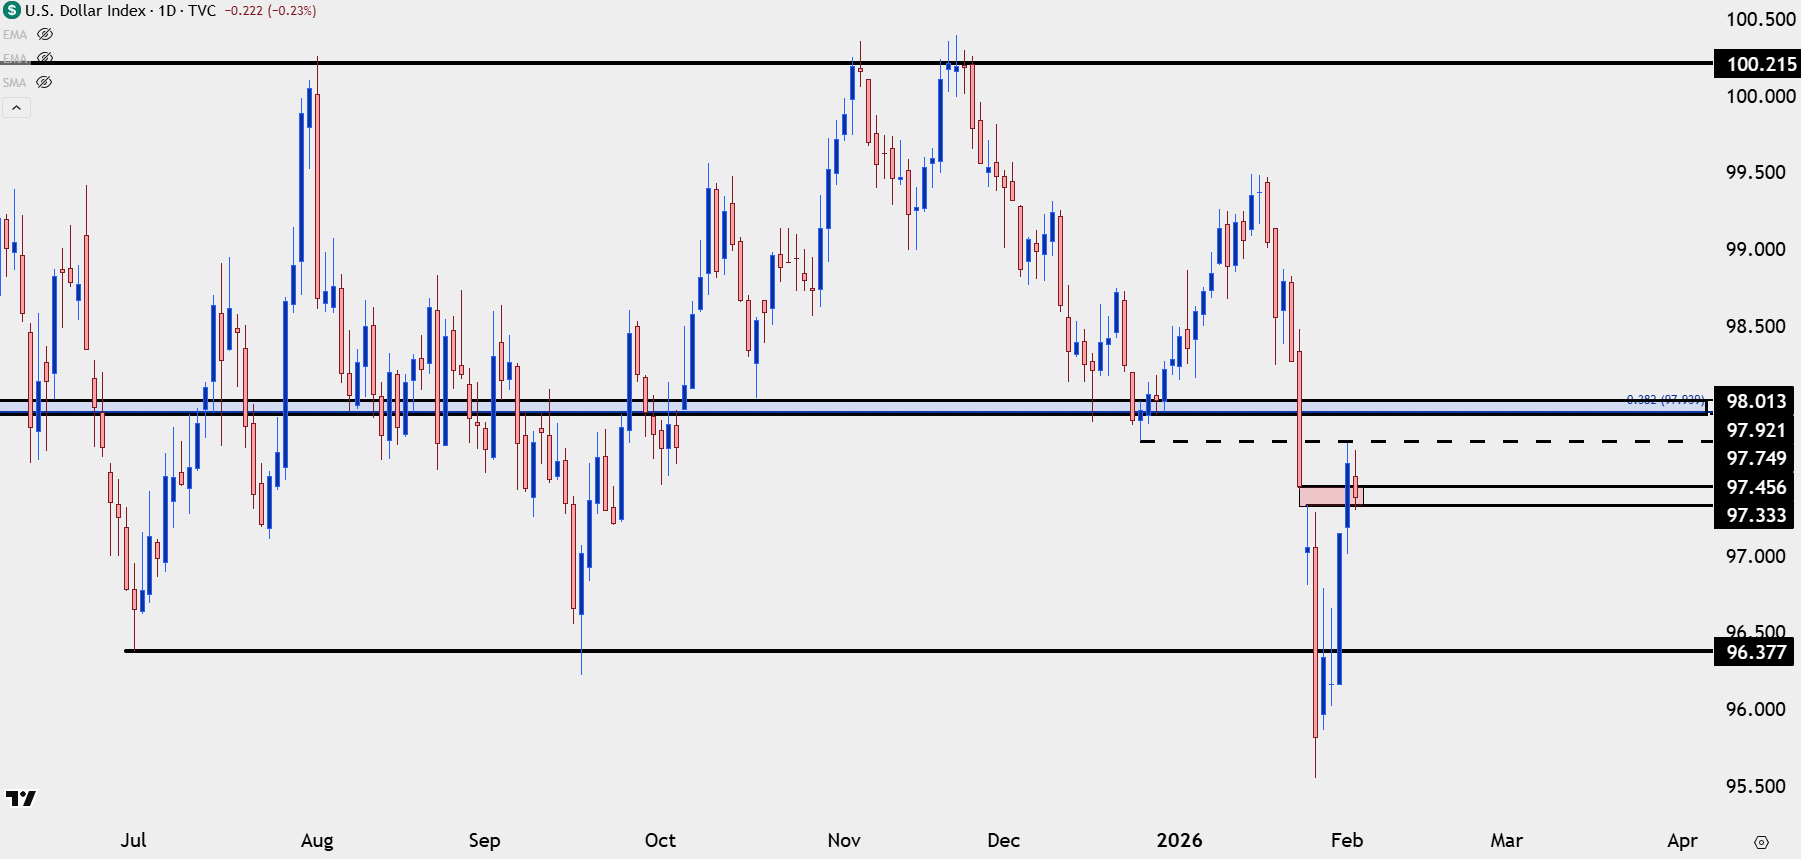
Chart prepared by James Stanley; data derived from Tradingview
GBP/USD
For USD-weakness I still prefer the bullish structure of GBP/USD. The pair has since pulled back for a support test at a prior resistance trendline. Also along this line, GBP/JPY remains of interest as that setup has played cleanly since last week’s webinar.
GBP/USD Daily Chart
Chart prepared by James Stanley; data derived from Tradingview
GBP/JPY
In last week’s webinar I looked at the structure in GBP/JPY as prices was testing prior range support, taking from around the 210 handle. That support has since held and buyers are pushing a rally up to a similar spot of resistance at 213.50. In the webinar, I looked at updated structure and higher-low support potential as taken from prior resistance.
GBP/JPY Four-Hour Chart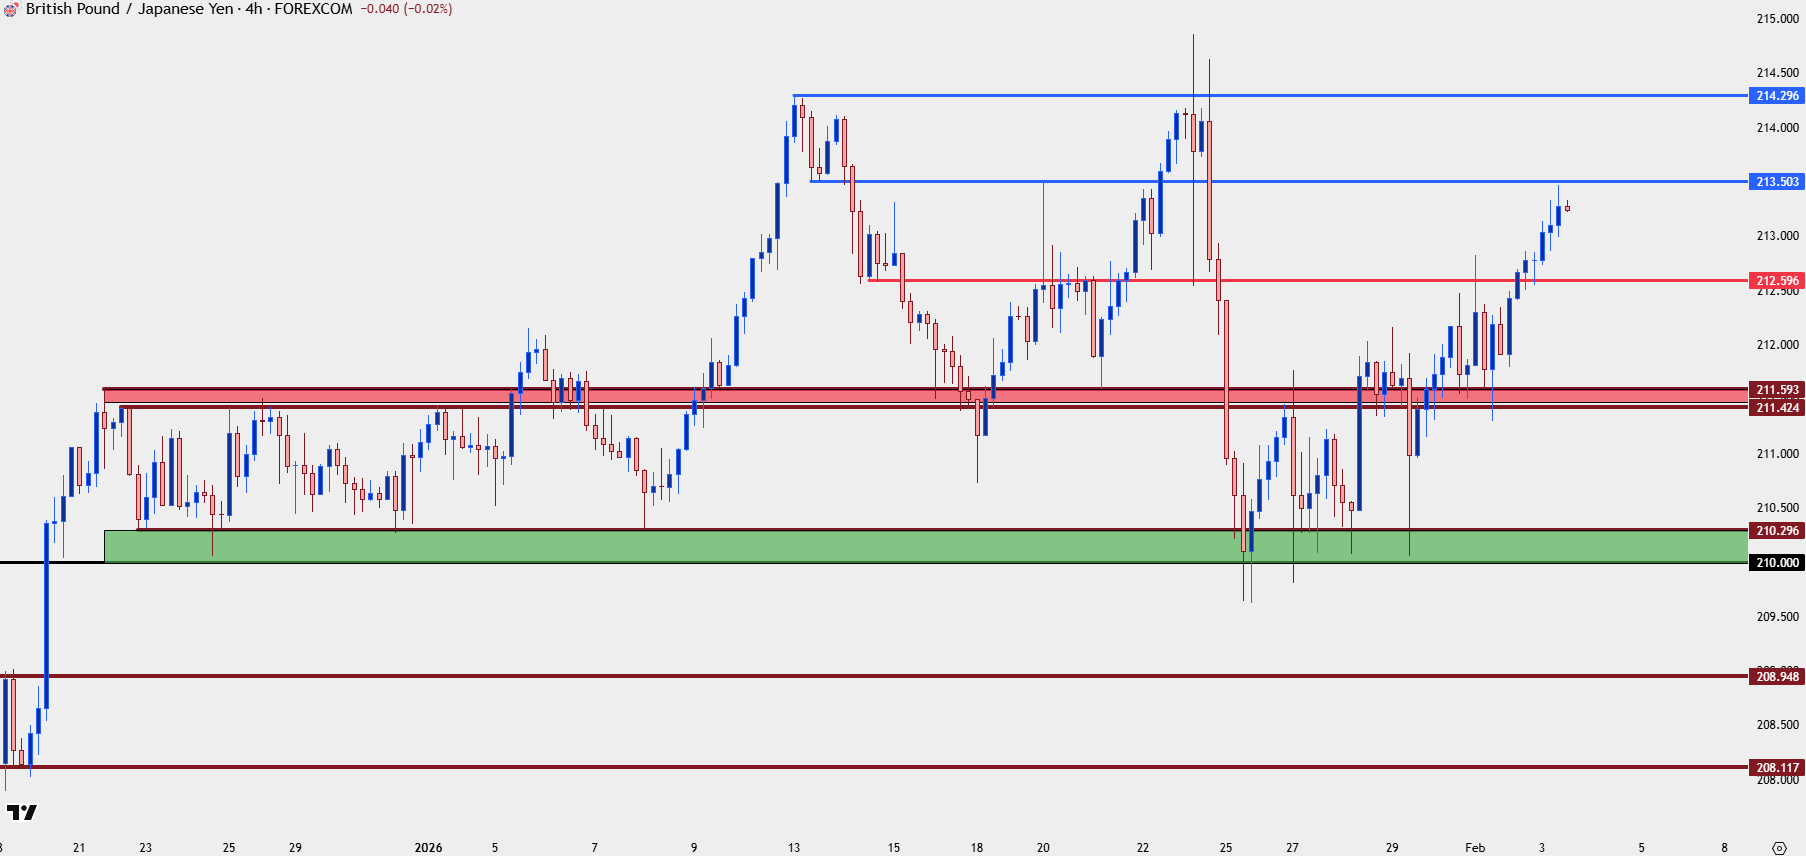
Chart prepared by James Stanley; data derived from Tradingview

USD/JPY
USD/JPY has come back to life with the help of those comments last week from US Treasury Secretary Scott Bessent and then Kevin Hassett on Friday. But – there’s still the very real problem of what happens at a 159.00 re-test, as the prior threats of intervention remain an issue. That’s less problematic at 156.00 but if the rally does stretch, it becomes a factor that should be considered.
For now, there’s bullish structure in here with support potential in the 154.45-155.00 zone that I had previously used for resistance last week. And for follow-through resistance, it’s the 157.90 level that I want to be cognizant of and, notably, the GBP/JPY setup above may be a cleaner venue to look for Yen-weakness to continue.
USD/JPY Four-Hour Chart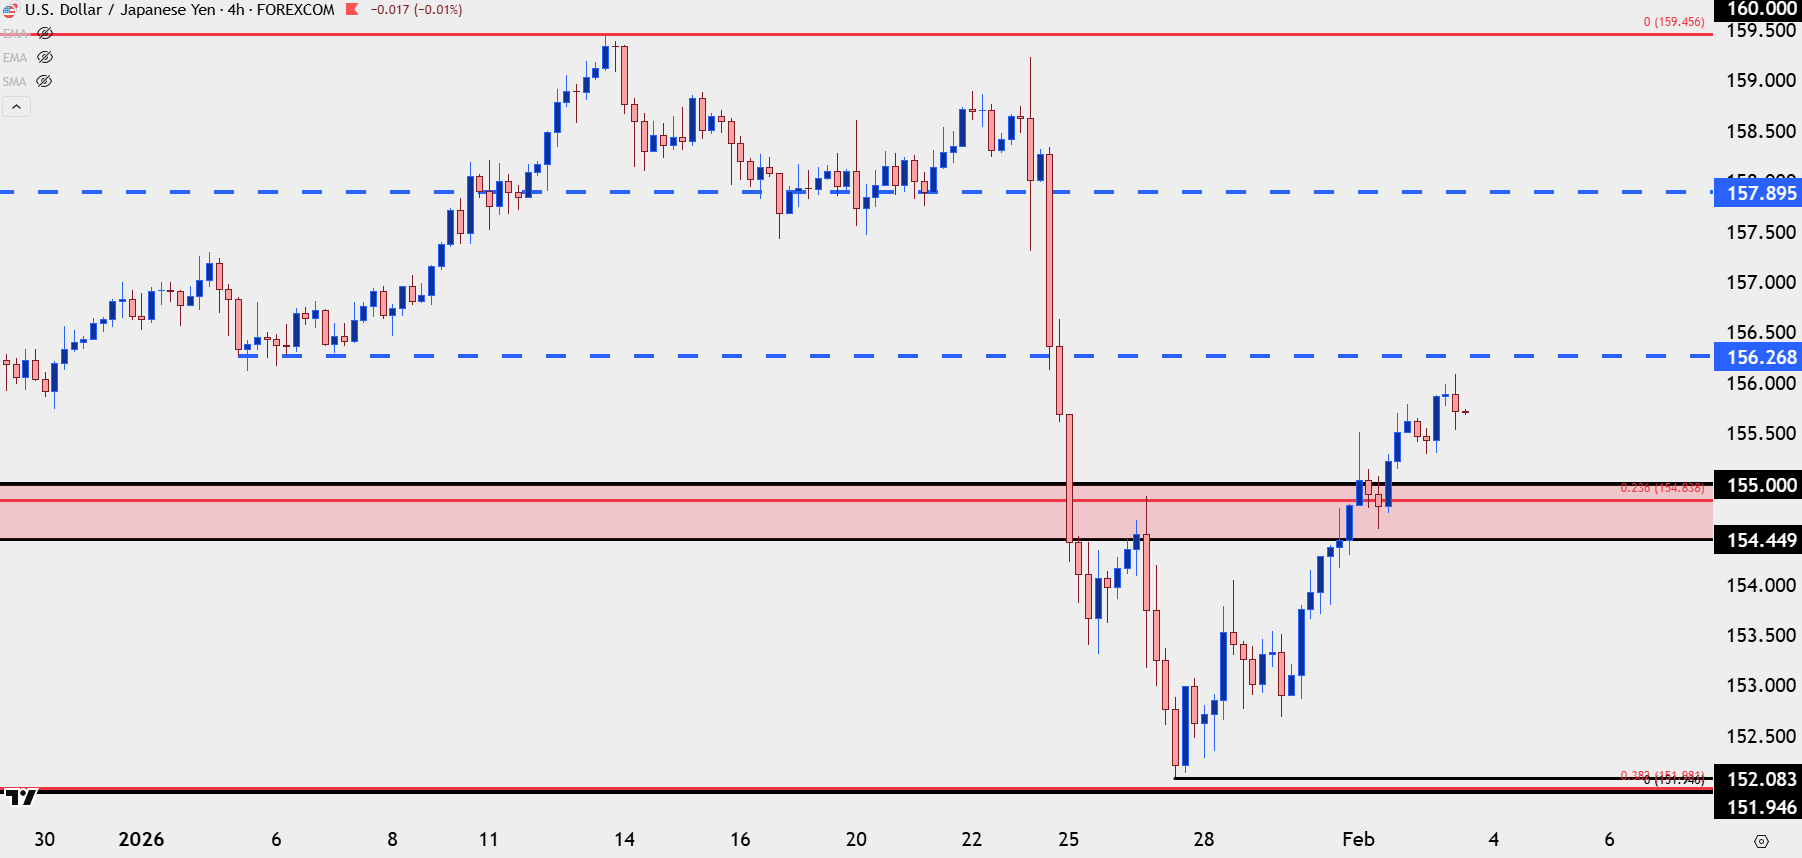
Chart prepared by James Stanley; data derived from Tradingview

EUR/USD
Given the state of the Yen above, if we are going to see USD-weakness coming back it’ll like need some help from the Euro. What could change that is greater signs of carry unwind whether it be somewhat exogenous via intervention or organic via longs bailing, but until then, there’s a couple of big spots of support potential in the EUR/USD pair – and there’s also an ECB meeting later this week.
On that part, it’s difficult to imagine that the ECB would want to see the EUR/USD pair above the 1.2000 handle. A stronger Euro puts pressure on inflation and growth and this could potentially even put the ECB in a spot where they’d be looking at rate cuts later in the year, which could, in-turn, push the currency lower. That’s not an item of concern currently but when the ECB comes to markets on Thursday it makes sense to think that they’ll try to guide the currency lower to try to avoid that fate.
From the daily, there’s still bullish structure since the 200-day moving average test a couple weeks ago but shorter-term sellers have been having their way, The support test looked at last week led to a bounce and failed run at 1.2000, and now sellers are pushing back towards trendline resistance from the bull pennant formation, with the longer-term Fibonacci levels at 1.1748 and 1.1686 below that.
EUR/USD Daily Chart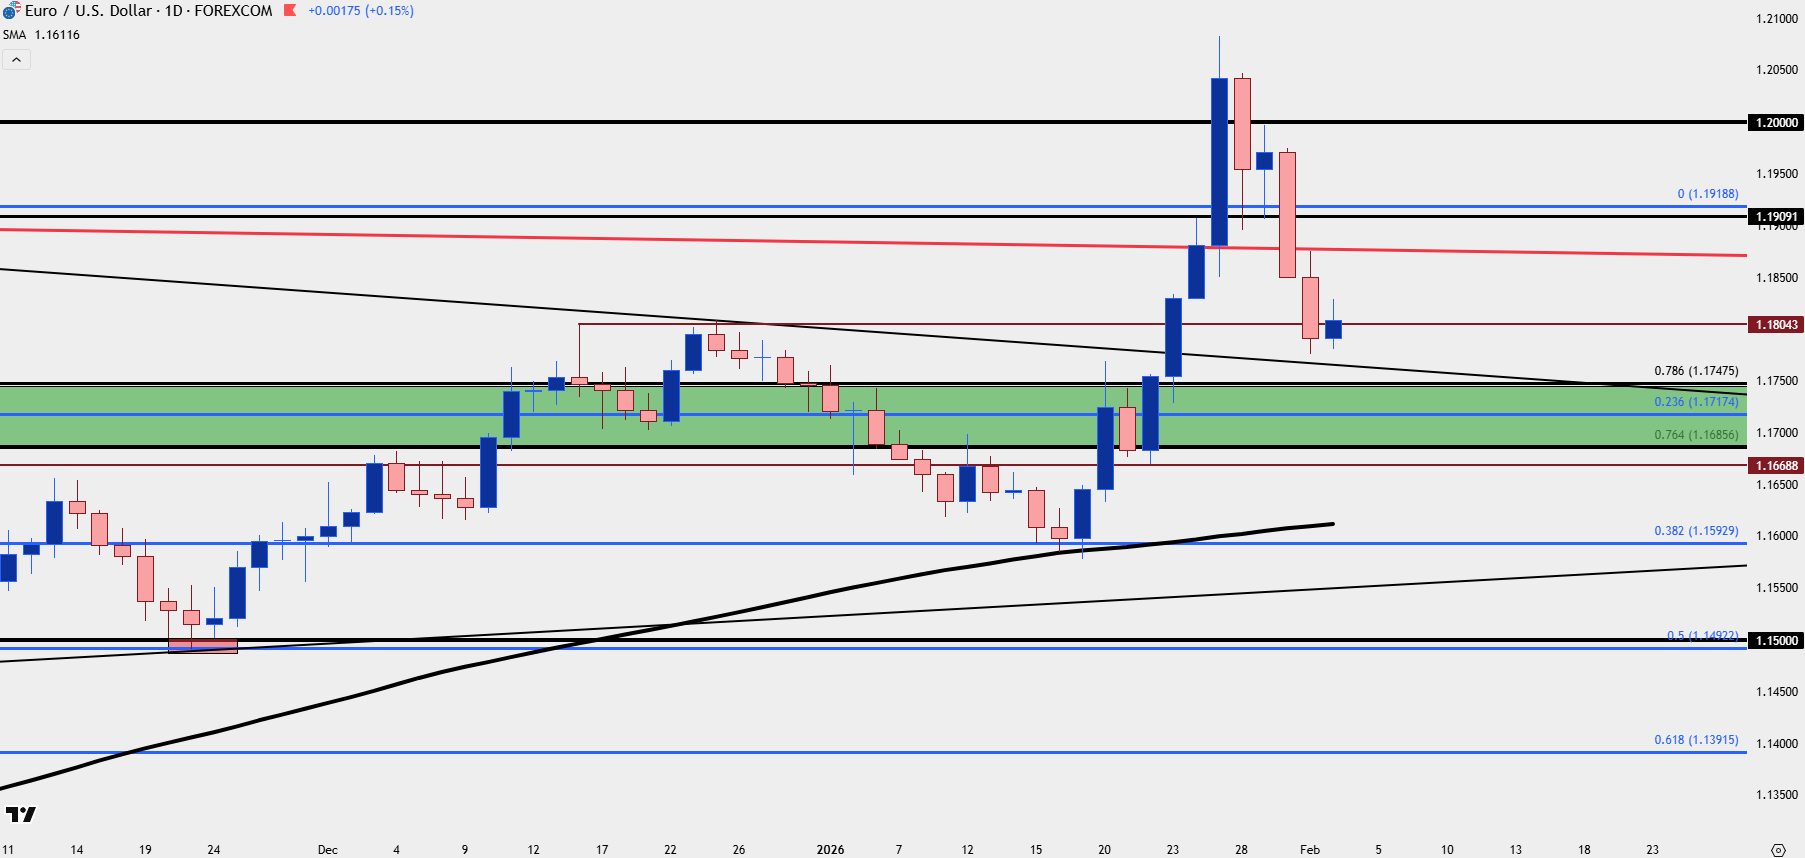
Chart prepared by James Stanley; data derived from Tradingview
Gold
As I said in the early part of the webinar gold remains my favored venue as there’s been intense volatility of late. The 5k level still looms large here and so far we’ve seen buyers shy away from a test there, and as of this writing there’s a dip below the $4900 level.
So far this week has been a story of recovery as the metal pushed down to the $4500 level after the open and then set a higher-low at $4600 yesterday. That price is now invalidation for bullish setups and there’s a shorter-term higher-low at $4750.
At this point there needs to be some evidence of a support hold to keep open the possibility of a 5k re-test or possibly more, and $4900 could still be that price if short-term bars close above that level, but there’s also $4850 and $4800 below that. If we get down to $4750 it’ll begin to look like bulls have failed and that’s where upside biases should come into question.
Gold 30-Minute Chart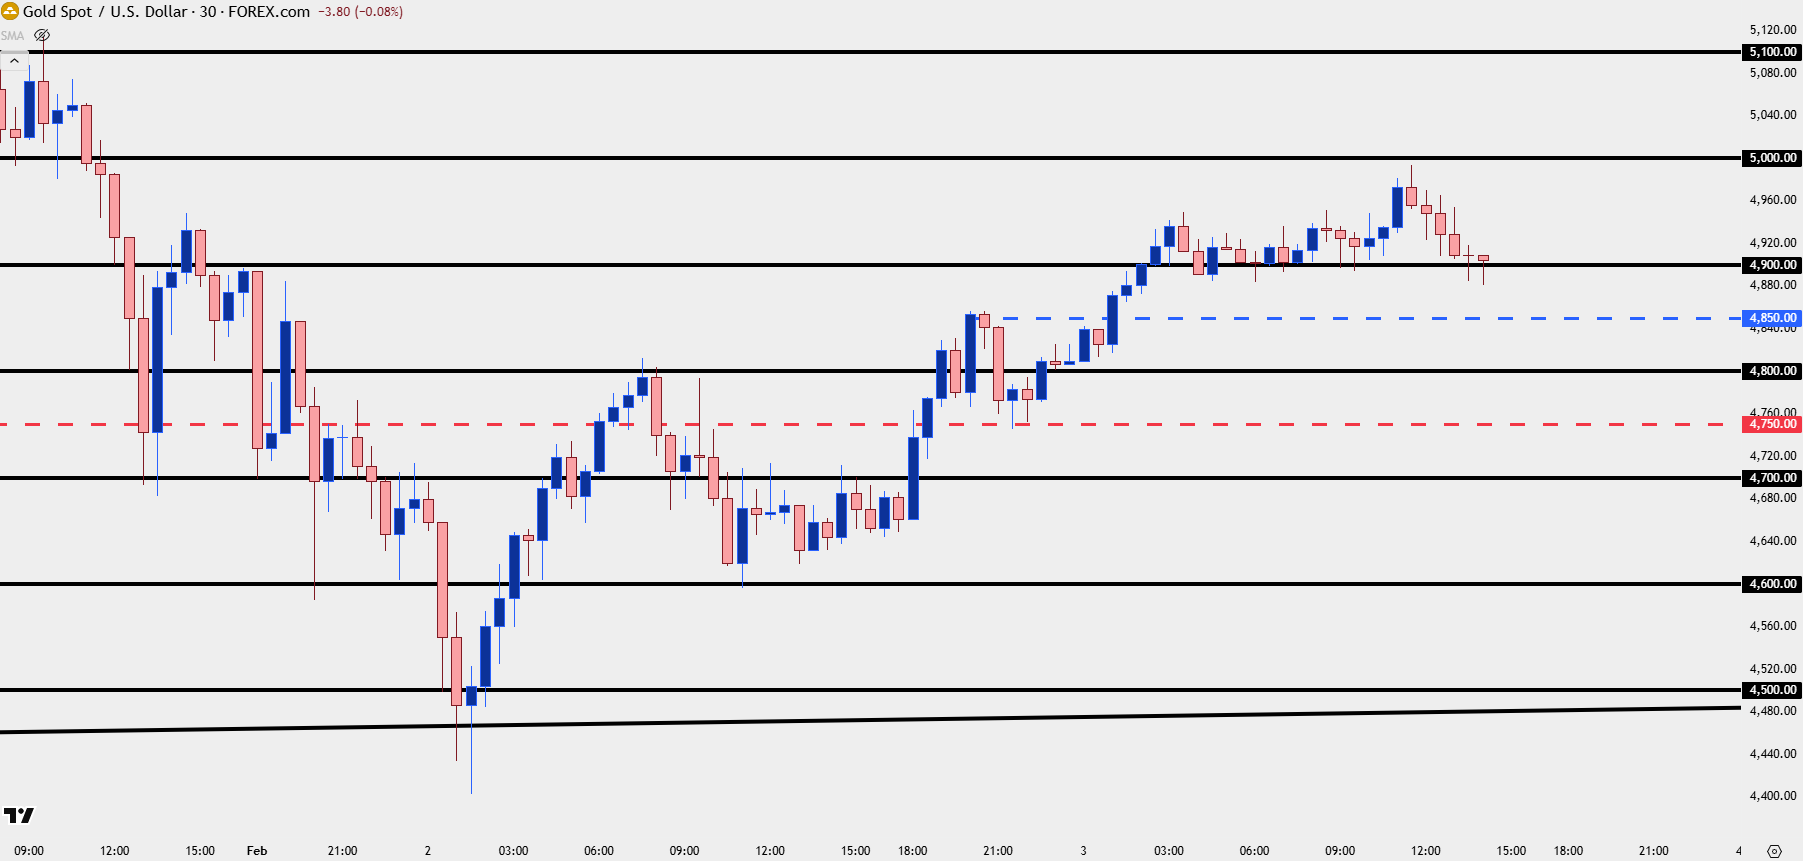
Chart prepared by James Stanley; data derived from Tradingview
--- written by James Stanley, Senior Market Analyst, Global Macro






