





Is the USDSEK DXY Correlation Broken
USD/SEK is often used as a proxy for the US Dollar Index
Share this:

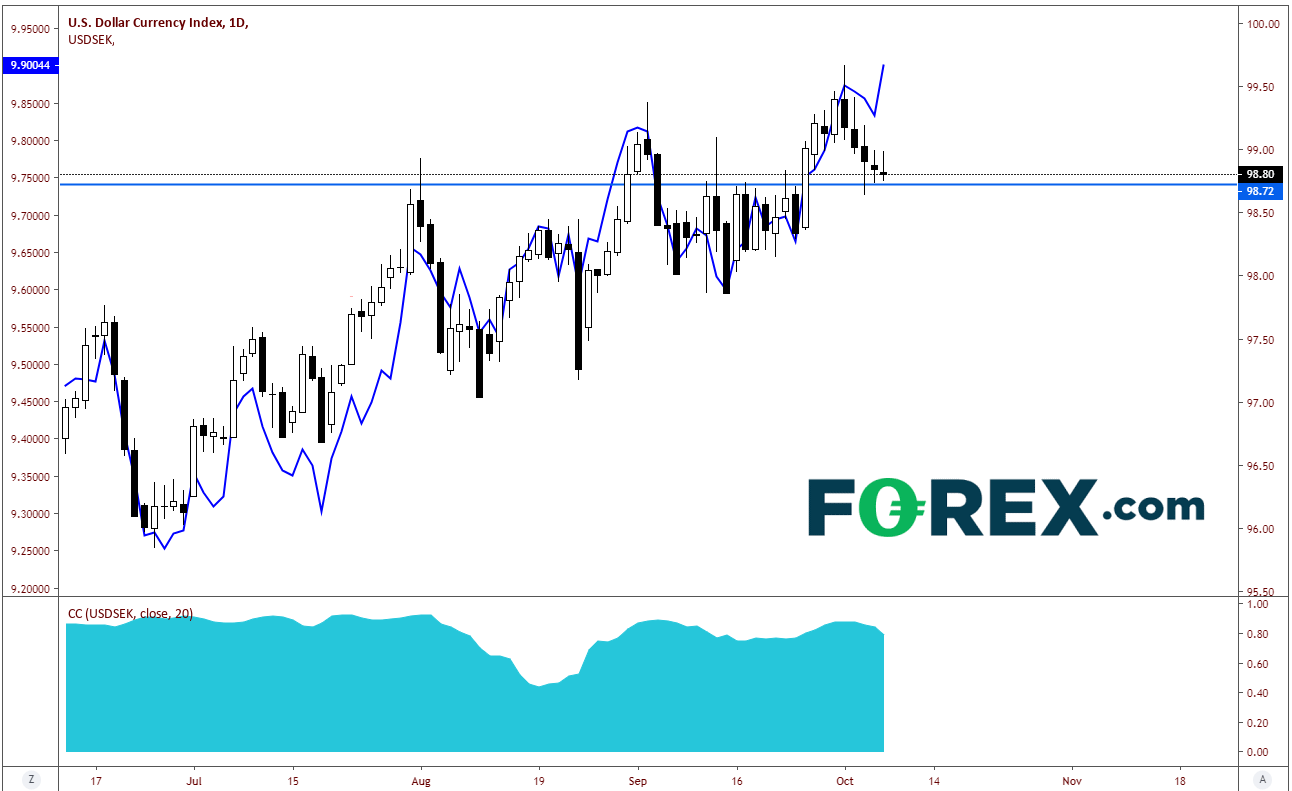
USD/SEK and DXY often move in the same direction. USD/SEK is often used as a proxy for the US Dollar Index for those who don’t have access to trade DXY. As a matter of fact, since mid-June the correlation coefficient on a daily timeframe for the two instruments been positive (meaning the 2 always move in the same direction), and the lowest readying since that date was +.46. However, today’s price action shows the 2 instruments diverging as the DXY is lower on the day and USD/SEK is higher.
Source: Tradingview, City Index
If this correlation is to continue, there needs to be some type of mean reversion in order for the USD/SEK to line up again (so they can move together). Either the USD/SEK has to pull back or the DXY has to move higher, or a little of both.
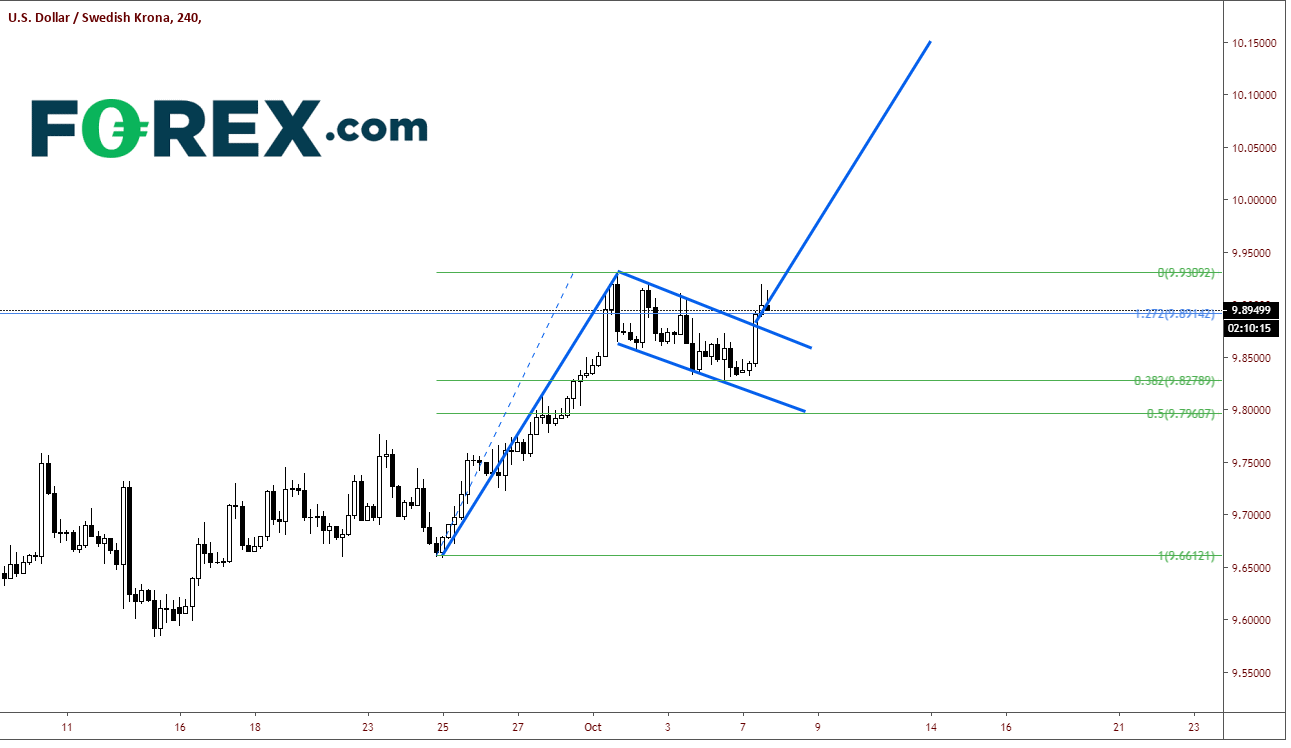
On a 240-minute timeframe, USD/SEK has broken out a flag pattern as prices could only pull back to the 38.2% Fibonacci retracement level from the low on September 24th to the highs on October 1st. The target of a flag pattern is the distance of the flagpole added to the breakout point of the flag. In this case the target is near 10.1500. However, price doesn’t always move in a straight line and the current candle is putting in an inverted hammer (reversal indication). This may mean price could pull back and test the downward sloping trending of the flag which is at 9.8756.
Source: Tradingview, City Index
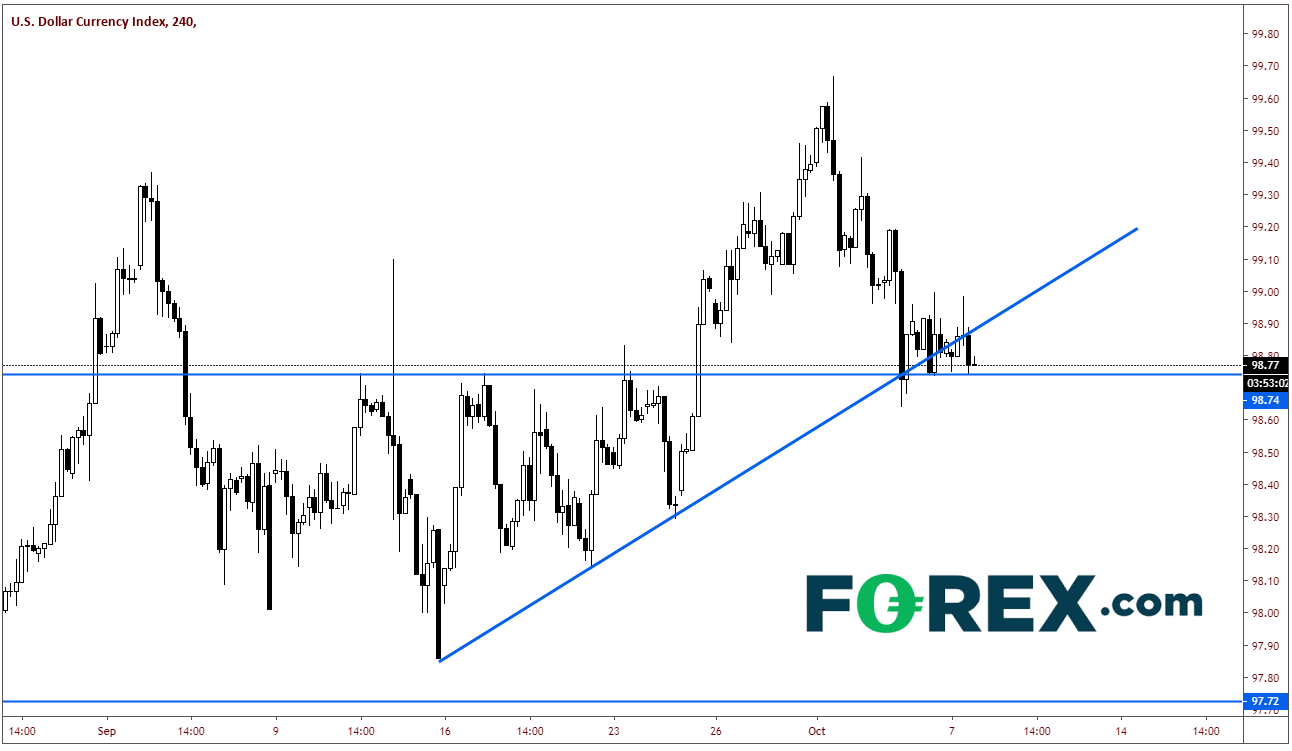
As far as DXY is concerned, on a 240-minute timeframe price has pulled back off the recent highs and is currently testing horizontal resistance near 98.74. Ideally, this price should hold and bounce back above the rising trendline towards 99.20 if USD/SEK is going to continue higher.
Source: Tradingview, City Index
If DXY moves below 98.64, there is room for the US Dollar Index to run lower. If the correlation is to remain intact, USD/SEK would have to pull back into the flag formation (with a false breakout) and test the bottom trendline of the flag pattern near 9.8115.
USD/SEK and DXY often move in the same direction. USD/SEK is often used as a proxy for the US Dollar Index for those who don’t have access to trade DXY. As a matter of fact, since mid-June the correlation coefficient on a daily timeframe for the two instruments been positive (meaning the 2 always move in the same direction), and the lowest readying since that date was +.46. However, today’s price action shows the 2 instruments diverging as the DXY is lower on the day and USD/SEK is higher.
Source: Tradingview, FOREX.COM
If this correlation is to continue, there needs to be some type of mean reversion in order for the USD/SEK to line up again (so they can move together). Either the USD/SEK has to pull back or the DXY has to move higher, or a little of both.
On a 240-minute timeframe, USD/SEK has broken out a flag pattern as prices could only pull back to the 38.2% Fibonacci retracement level from the low on September 24th to the highs on October 1st. The target of a flag pattern is the distance of the flagpole added to the breakout point of the flag. In this case the target is near 10.1500. However, price doesn’t always move in a straight line and the current candle is putting in an inverted hammer (reversal indication). This may mean price could pull back and test the downward sloping trending of the flag which is at 9.8756.
Source: Tradingview, FOREX.COM
As far as DXY is concerned, on a 240-minute timeframe price has pulled back off the recent highs and is currently testing horizontal resistance near 98.74. Ideally, this price should hold and bounce back above the rising trendline towards 99.20 if USD/SEK is going to continue higher.
Source: Tradingview, FOREX.COM
If DXY moves below 98.64, there is room for the US Dollar Index to run lower. If the correlation is to remain intact, USD/SEK would have to pull back into the flag formation (with a false breakout) and test the bottom trendline of the flag pattern near 9.8115.


Open an account in minutes
Experience award-winning platforms with fast and secure execution, and enjoy tight spreads from 0.5 pts on FX and 0.3 pts on indices.
Economic calendar
Web Trader platform
Our sophisticated web-based platform is packed with features.
Related articles

Japanese Yen Forecast: USD/JPY 4% Rally Challenges Post-Intervention Downtrend 9 24 2026
USD/JPY momentum has shifted sharply higher, putting a major resistance confluence in focus as U.S. and Japanese event risk builds.


Oil Quietly Hands the Fed a Reason to Stay Hawkish
Oil prices and the U.S. dollar are both on the front foot as elevated energy costs feed Fed warnings that inflation may prove sticky.


USD/JPY outlook: Hawkish Fed recalibration pressures the yen
Stronger US growth momentum and rising Treasury yields are keeping USD/JPY pointed higher, even as Japanese policymakers try to limit the pressure building across domestic markets.

This report is intended for general circulation only. It should not be construed as a recommendation, or an offer (or solicitation of an offer) to buy or sell any financial products. The information provided does not take into account your specific investment objectives, financial situation or particular needs. Before you act on any recommendation that may be contained in this report, independent advice ought to be sought from a financial adviser regarding the suitability of the investment product, taking into account your specific investment objectives, financial situation or particular needs.
StoneX Financial Pte. Ltd., may distribute reports produced by its respective foreign entities or affiliates within the StoneX group of companies or third parties pursuant to an arrangement under Regulation 32C of the Financial Advisers Regulations. Where the report is distributed to a person in Singapore who is not an accredited investor, expert investor or an institutional investor (as defined in the Securities Futures Act), StoneX Financial Pte. Ltd. accepts legal responsibility to such persons for the contents of the report only to the extent required by law. Singapore recipients should contact StoneX Financial Pte. Ltd. at 6826 9988 for matters arising from, or in connection with the report.
In the case of all other recipients of this report, to the extent permitted by applicable laws and regulations neither StoneX Financial Pte. Ltd. nor its associated companies will be responsible or liable for any loss or damage incurred arising out of, or in connection with, any use of the information contained in this report and all such liability is hereby expressly disclaimed. No representation or warranty is made, express or implied, that the content of this report is complete or accurate.
StoneX Financial Pte. Ltd. is not under any obligation to update this report.
Trading CFDs carries a high level of risk that may not be suitable for some investors. Consider your investment objectives, level of experience, financial resources, risk appetite and other relevant circumstances carefully. The possibility exists that you could lose some or all of your investments, including your initial deposits. If in doubt, please seek independent expert advice. Visit www.forex.com/en-sg/terms-and-policies for the complete Risk Disclosure Statement.