





JPY Technical Analysis into BoJ: USD/JPY, EUR/JPY, GBP/JPY
It’s a big week for the Japanese Yen. While the BoJ may not pose any moves to rates the quarterly outlook could keep the JPY on the move after the last release triggered a breakdown in USD/JPY.
Share this:

Japanese Yen Talking Points:
- USD/JPY has snapped back after finding resistance at 144.00 last Friday. EUR/JPY has similarly snapped back from a resistance test at a bearish trendline looked at last week.
- The big driver for the Yen this week is the Wednesday night/Thursday morning BoJ rate decision. Given the uncertainty around tariffs I think the traditionally conservative BoJ will stand pat, but it’s a quarterly meeting meaning updated projections. When these were last released on January 27th, it fired a fresh lower-low in USD/JPY when the pair was trading around the 156.00 level, and USD/JPY has been spiraling lower ever since.
USD/JPY put in a sizable bounce last week after sellers failed to hold the break at the 140.00 level, with the 144.00 handle coming in to retain the highs on Friday. So far this week, however, Yen bulls are back at it and both USD/JPY and EUR/JPY have shown notable moves lower.
It’s a big week for the Japanese Yen as we hear from the Bank of Japan on Wednesday night (Thursday morning in Japan). The traditionally conservative Central Bank seems likely to avoid any near-term rate moves given the brash uncertainty around tariffs. But, that doesn’t mean this meeting will be a non-event as it’s a quarterly meeting, and that means updated outlooks and guidance which when last released from the BoJ on January 27th, created a notable move of Yen-strength that’s largely remained in control ever since.
In USD/JPY, the pair pushed down to a fresh lower-low on Jan 27th, following a hold at a lower-high. That then produced another lower-high and the pair continued to fall from the 155/156 area of the chart all the way until last week’s test of the 140.00 level.
USD/JPY Daily Chart
 Chart prepared by James Stanley; data derived from Tradingview
USD/JPY and Bear Traps
Despite the sell-off that’s spanned for much of this year, there’s still been several bear traps brewed along the way. The 145.00 level is a great example of such, as this price came into play as support earlier in April and held the lows on multiple tests until sellers were finally able to break through. For those running breakout strategies on tests through 145.00, that probably meant multiple failed attempts until one finally took hold. And then last week’s 140.00 test was similar, as the pair just briefly sat below the big figure before snapping back and, eventually, running 400 pips higher.
On a shorter-term basis, there could be a nearby level of note to look for lower-high resistance to show around the 143.22-143.25 area; and on a bigger picture basis, it’s that 145.00 level that stands out as resistance potential as that price had shown for support numerous time before ultimately giving way. To date, it still hasn’t shown as resistance and if it can come into play, that becomes a massive spot to gauge sellers motivation in continuing the move.
That said, I still think Yen-strength could be more attractive against the Euro; and Yen-weakness more attractive against the British Pound with both markets looked at below.
USD/JPY Four-Hour Price Chart
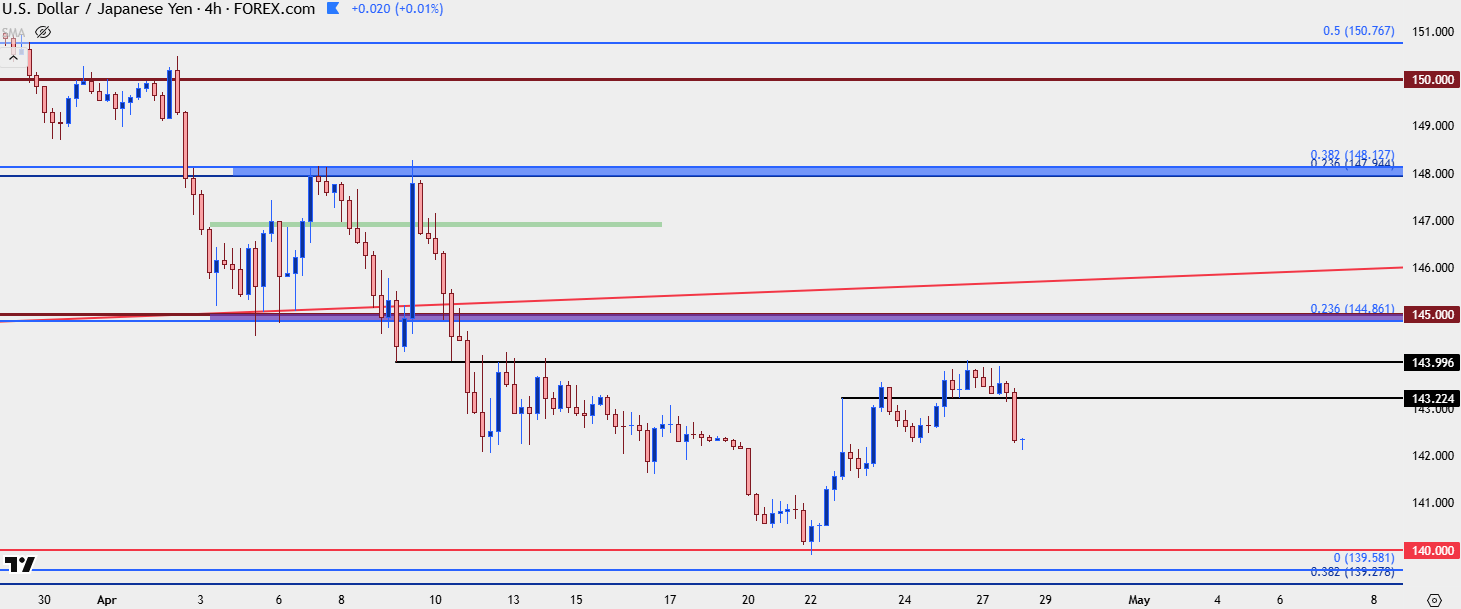 Chart prepared by James Stanley; data derived from Tradingview
EUR/JPY
EUR/JPY has spent the past six weeks showing resistance at a big area on the chart, spanning from 163.00-163.38. The latter price is the 23.6% retracement of the 2022-2024 major move and last week, there was also a trendline in-play as discussed in these articles. That trendline held the highs on Friday and it’s largely been a one-way show ever since.
EUR/JPY Weekly Price Chart
 Chart prepared by James Stanley; data derived from Tradingview
EUR/JPY Shorter-Term
The move ever since the trendline inflection has been brisk and one-sided, and those are the types of moves that can be challenging to chase. From the below two-hour chart, I’ve highlighted an area of interest for shorter-term lower-highs, around 162.68; and if that doesn’t hold, then the 163.00 level could come back as a point of interest for bearish continuation scenarios.
EUR/JPY Two Hour Price Chart
 Chart prepared by James Stanley; data derived from Tradingview
GBP/JPY
In last week’s JPY article I looked at GBP/JPY for Yen-weakness scenarios and that still remains of interest, at this point, Given the Yen-strength that’s shown against both the Euro and US Dollar, the GBP/JPY daily chart shows a more moderate pullback and this retains the bullish structure looked at last week.
The ascending triangle breakout had a support test at 190.00 on Friday, which then led to a fresh high. Ideally at this point buyers would hold support above that 190.00 level, exhibiting some element of anticipation or defense of the big figure, and the 190.31 level would be an optimal level for such a reading to show. If it doesn’t, however, and price does dip down for another 190.00 test, the key will be gauging a bullish response to illustrate buyers defense of the big figure. I would want to see a strong reaction to the pair trading below that level, with values in the 189’s eliciting an aggressive reaction from bulls. If that’s not there, then I’d expect Yen-strength to be carrying a heavier weight which would make the above setup in EUR/JPY as a more attractive venue.
GBP/JPY Daily Price Chart

--- written by James Stanley, Senior Strategist
Japanese Yen Talking Points:
- USD/JPY has snapped back after finding resistance at 144.00 last Friday. EUR/JPY has similarly snapped back from a resistance test at a bearish trendline looked at last week.
- The big driver for the Yen this week is the Wednesday night/Thursday morning BoJ rate decision. Given the uncertainty around tariffs I think the traditionally conservative BoJ will stand pat, but it’s a quarterly meeting meaning updated projections. When these were last released on January 27th, it fired a fresh lower-low in USD/JPY when the pair was trading around the 156.00 level, and USD/JPY has been spiraling lower ever since.
USD/JPY put in a sizable bounce last week after sellers failed to hold the break at the 140.00 level, with the 144.00 handle coming in to retain the highs on Friday. So far this week, however, Yen bulls are back at it and both USD/JPY and EUR/JPY have shown notable moves lower.
It’s a big week for the Japanese Yen as we hear from the Bank of Japan on Wednesday night (Thursday morning in Japan). The traditionally conservative Central Bank seems likely to avoid any near-term rate moves given the brash uncertainty around tariffs. But, that doesn’t mean this meeting will be a non-event as it’s a quarterly meeting, and that means updated outlooks and guidance which when last released from the BoJ on January 27th, created a notable move of Yen-strength that’s largely remained in control ever since.
In USD/JPY, the pair pushed down to a fresh lower-low on Jan 27th, following a hold at a lower-high. That then produced another lower-high and the pair continued to fall from the 155/156 area of the chart all the way until last week’s test of the 140.00 level.
USD/JPY Daily Chart
USD/JPY and Bear Traps
Despite the sell-off that’s spanned for much of this year, there’s still been several bear traps brewed along the way. The 145.00 level is a great example of such, as this price came into play as support earlier in April and held the lows on multiple tests until sellers were finally able to break through. For those running breakout strategies on tests through 145.00, that probably meant multiple failed attempts until one finally took hold. And then last week’s 140.00 test was similar, as the pair just briefly sat below the big figure before snapping back and, eventually, running 400 pips higher.
On a shorter-term basis, there could be a nearby level of note to look for lower-high resistance to show around the 143.22-143.25 area; and on a bigger picture basis, it’s that 145.00 level that stands out as resistance potential as that price had shown for support numerous time before ultimately giving way. To date, it still hasn’t shown as resistance and if it can come into play, that becomes a massive spot to gauge sellers motivation in continuing the move.
That said, I still think Yen-strength could be more attractive against the Euro; and Yen-weakness more attractive against the British Pound with both markets looked at below.
USD/JPY Four-Hour Price Chart
EUR/JPY
EUR/JPY has spent the past six weeks showing resistance at a big area on the chart, spanning from 163.00-163.38. The latter price is the 23.6% retracement of the 2022-2024 major move and last week, there was also a trendline in-play as discussed in these articles. That trendline held the highs on Friday and it’s largely been a one-way show ever since.
EUR/JPY Weekly Price Chart
EUR/JPY Shorter-Term
The move ever since the trendline inflection has been brisk and one-sided, and those are the types of moves that can be challenging to chase. From the below two-hour chart, I’ve highlighted an area of interest for shorter-term lower-highs, around 162.68; and if that doesn’t hold, then the 163.00 level could come back as a point of interest for bearish continuation scenarios.
EUR/JPY Two Hour Price Chart
GBP/JPY
In last week’s JPY article I looked at GBP/JPY for Yen-weakness scenarios and that still remains of interest, at this point, Given the Yen-strength that’s shown against both the Euro and US Dollar, the GBP/JPY daily chart shows a more moderate pullback and this retains the bullish structure looked at last week.
The ascending triangle breakout had a support test at 190.00 on Friday, which then led to a fresh high. Ideally at this point buyers would hold support above that 190.00 level, exhibiting some element of anticipation or defense of the big figure, and the 190.31 level would be an optimal level for such a reading to show. If it doesn’t, however, and price does dip down for another 190.00 test, the key will be gauging a bullish response to illustrate buyers defense of the big figure. I would want to see a strong reaction to the pair trading below that level, with values in the 189’s eliciting an aggressive reaction from bulls. If that’s not there, then I’d expect Yen-strength to be carrying a heavier weight which would make the above setup in EUR/JPY as a more attractive venue.
GBP/JPY Daily Price Chart
--- written by James Stanley, Senior Strategist
Related tags:


Open an account in minutes
Experience award-winning platforms with fast and secure execution, and enjoy tight spreads from 0.5 pts on FX and 0.3 pts on indices.
Economic calendar
Web Trader platform
Our sophisticated web-based platform is packed with features.
Related articles

USD into a Massive Week as Yields Fly and Gold Breaks
It’s a huge week with PCE and NFP, but it’s what’s happening off of the calendar that demands attention with US yields flying to fresh multi-decade highs.

USDJPY Forecast Intervention Fears Clash with Dollar Strength
Recent trading sessions have produced mixed results for the Japanese yen. By the end of last week, USD/JPY had fallen by more than 1.00%, reflecting a modest recovery in the yen. However, the start of this week has seen the pair move slightly back in favor of the U.S. dollar, posting gains of around 0.04%.


USD/JPY Weekly Outlook: Payrolls loom as US rates remain the dominant driver
Strong US growth and hawkish Fed pricing continue to support USD/JPY, while intervention risk appears to be kicking in at lower levels

This report is intended for general circulation only. It should not be construed as a recommendation, or an offer (or solicitation of an offer) to buy or sell any financial products. The information provided does not take into account your specific investment objectives, financial situation or particular needs. Before you act on any recommendation that may be contained in this report, independent advice ought to be sought from a financial adviser regarding the suitability of the investment product, taking into account your specific investment objectives, financial situation or particular needs.
StoneX Financial Pte. Ltd., may distribute reports produced by its respective foreign entities or affiliates within the StoneX group of companies or third parties pursuant to an arrangement under Regulation 32C of the Financial Advisers Regulations. Where the report is distributed to a person in Singapore who is not an accredited investor, expert investor or an institutional investor (as defined in the Securities Futures Act), StoneX Financial Pte. Ltd. accepts legal responsibility to such persons for the contents of the report only to the extent required by law. Singapore recipients should contact StoneX Financial Pte. Ltd. at 6826 9988 for matters arising from, or in connection with the report.
In the case of all other recipients of this report, to the extent permitted by applicable laws and regulations neither StoneX Financial Pte. Ltd. nor its associated companies will be responsible or liable for any loss or damage incurred arising out of, or in connection with, any use of the information contained in this report and all such liability is hereby expressly disclaimed. No representation or warranty is made, express or implied, that the content of this report is complete or accurate.
StoneX Financial Pte. Ltd. is not under any obligation to update this report.
Trading CFDs carries a high level of risk that may not be suitable for some investors. Consider your investment objectives, level of experience, financial resources, risk appetite and other relevant circumstances carefully. The possibility exists that you could lose some or all of your investments, including your initial deposits. If in doubt, please seek independent expert advice. Visit www.forex.com/en-sg/terms-and-policies for the complete Risk Disclosure Statement.