







Major index technical update DJIA Nasdaq 100 DAX FTSE
We highlight the key trends, levels to watch, and technical biases for four major indices heading into the summer...
Share this:

June usually marks a drought for major earnings releases, with Q2 earnings season not starting in earnest until mid-July, and major central banks are generally in a near-term holding pattern as they await more clarity on how economies are recovering from a pandemic-driven global recession, so it’s a good time to take a step back and review the technical outlook for major global indices.
Below, we highlight the key trends, levels to watch, and technical biases for four major indices:
Dow Jones Industrial Average (DJIA) Technical Analysis
Medium-term trend: Up
Key support: 33,600
Key resistance: 34,800
Near-term technical bias: Bullish
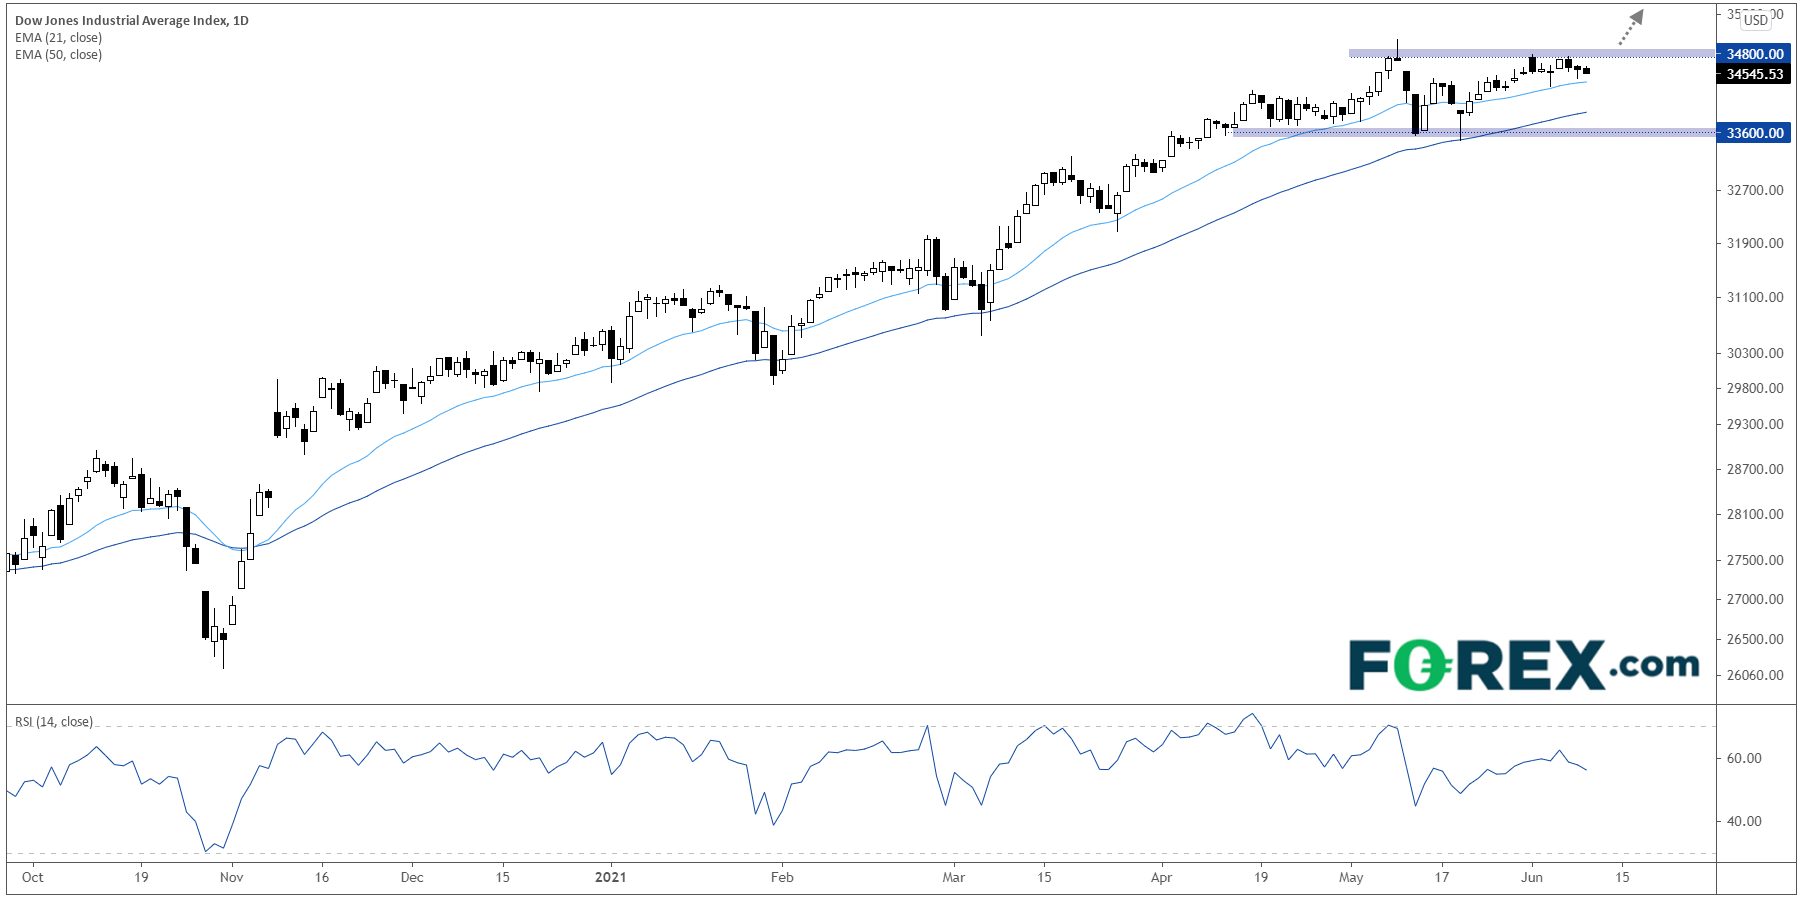
The oldest US index has been on a tear since the COVID-driven trough last March, though prices have taken a bit of a breather over the past two months. The recent consolidation between support at 33,600 and 34,800 has alleviated the overbought condition in the RSI indicator and allowed the longer-term 200-day exponential moving average time to “catch up” with prices; in other words, the recent price action can be viewed as a healthy pause within the context of a longer-term uptrend. Now, traders will watch for a confirmed break above 34,800 to signal the next leg higher in the uptrend, with only a break below the 50-day EMA and horizontal support at 33,600 calling the bullish bias into question.
Source: TradingView, StoneX
Nasdaq 100 (NDX) Technical Analysis
Medium-term trend: Sideways
Key support: 13,000
Key resistance: 14,500
Near-term technical bias: Neutral
Of all four indices we examine here, the tech-heavy Nasdaq 100 is arguably the weakest from a technical perspective. Prices are trading above both the upward-trending 21- and 50-day EMAs, but only marginally, and the RSI indicator hasn’t hit “overbought” territory yet this year, indicating tepid buying pressure. After months of choppy, inconsistent trade, bulls will need to see a confirmed break above the year-to-date high at 14,050 to renew the longer-term bullish trend and open the door for a move toward 15,000 this year.
Source: TradingView, StoneX
DAX (GE 30) Technical Analysis
Medium-term trend: Up
Key support: 15,500
Key resistance: 15,750
Near-term technical bias: Bullish
In contrast, Germany’s benchmark bourse is clearly in the strongest technical position of the major indices. The DAX set a fresh record high just last week and pulled back to bounce off previous-resistance-turned-support at 15,500 in today’s trade, signaling that the breakout is more likely legitimate. The RSI is not in overbought territory, signaling the potential for more upside in the short term as long as the key 15,500 level holds.
Source: TradingView, StoneX
FTSE 100 (UK 100) Technical Analysis
Medium-term trend: Up
Key support: 6,800
Key resistance: 7,150
Near-term technical bias: Bullish
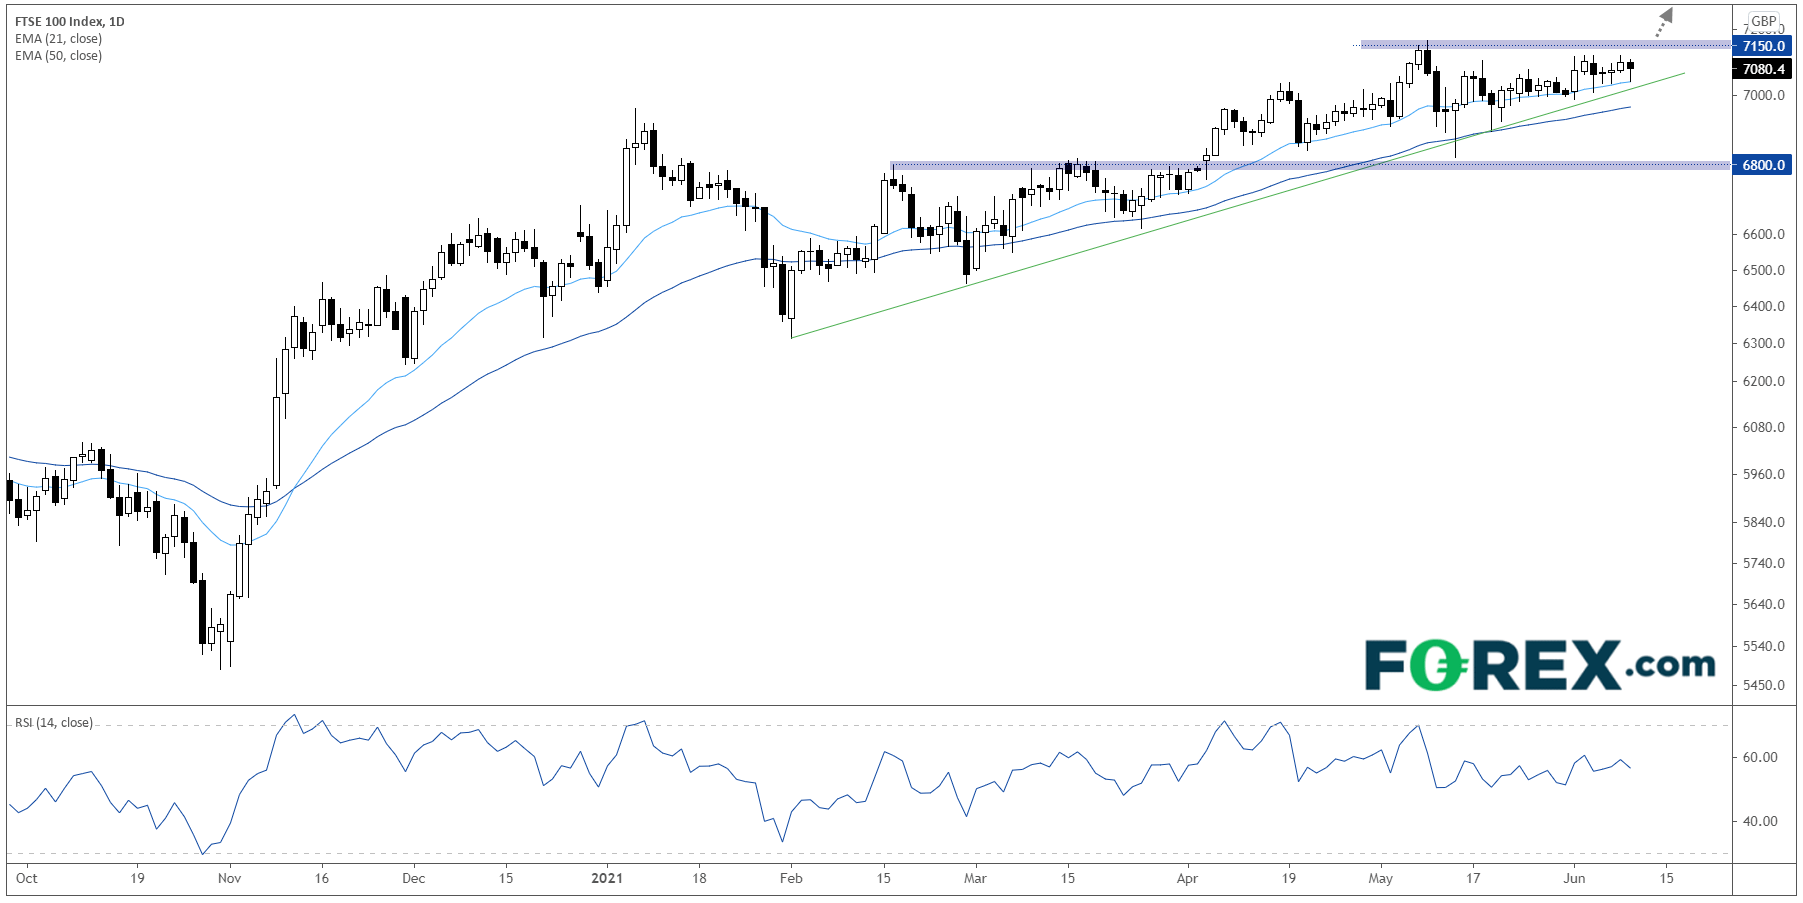
Looking at its chart, the UK’s FTSE 100 index is a middle-of-the-road amalgamation of the other indices we’ve examined so far. The medium-term trend is clearly still bullish, with prices holding above their upward-trending 21- and 50-day EMAs and the RSI indicator consolidating after touching overbought territory last month. As with the Dow, the month-to-date sideways consolidation should be viewed as a healthy development for the longer-term trend unless near-term support in the 7,000 is broken, whereas a strong breakout above 7,150 would strengthen the bullish case for a retest of record highs in the upper-7,000s later this year.
Source: TradingView, StoneX
How to trade with City Index
Follow these easy steps to start trading with City Index today:
- Open a City Index account, or log-in if you’re already a customer.
- Search for the market you want to trade in our award-winning platform.
- Choose your position and size, and your stop and limit levels.
- Place the trade.
June usually marks a drought for major earnings releases, with Q2 earnings season not starting in earnest until mid-July, and major central banks are generally in a near-term holding pattern as they await more clarity on how economies are recovering from a pandemic-driven global recession, so it’s a good time to take a step back and review the technical outlook for major global indices.
Below, we highlight the key trends, levels to watch, and technical biases for four major indices:
Dow Jones Industrial Average (DJIA) Technical Analysis
Medium-term trend: Up
Key support: 33,600
Key resistance: 34,800
Near-term technical bias: Bullish
The oldest US index has been on a tear since the COVID-driven trough last March, though prices have taken a bit of a breather over the past two months. The recent consolidation between support at 33,600 and 34,800 has alleviated the overbought condition in the RSI indicator and allowed the longer-term 200-day exponential moving average time to “catch up” with prices; in other words, the recent price action can be viewed as a healthy pause within the context of a longer-term uptrend. Now, traders will watch for a confirmed break above 34,800 to signal the next leg higher in the uptrend, with only a break below the 50-day EMA and horizontal support at 33,600 calling the bullish bias into question.
Source: TradingView, StoneX
Nasdaq 100 (NDX) Technical Analysis
Medium-term trend: Sideways
Key support: 13,000
Key resistance: 14,500
Near-term technical bias: Neutral
Of all four indices we examine here, the tech-heavy Nasdaq 100 is arguably the weakest from a technical perspective. Prices are trading above both the upward-trending 21- and 50-day EMAs, but only marginally, and the RSI indicator hasn’t hit “overbought” territory yet this year, indicating tepid buying pressure. After months of choppy, inconsistent trade, bulls will need to see a confirmed break above the year-to-date high at 14,050 to renew the longer-term bullish trend and open the door for a move toward 15,000 this year.
Source: TradingView, StoneX
DAX (GE 30) Technical Analysis
Medium-term trend: Up
Key support: 15,500
Key resistance: 15,750
Near-term technical bias: Bullish
In contrast, Germany’s benchmark bourse is clearly in the strongest technical position of the major indices. The DAX set a fresh record high just last week and pulled back to bounce off previous-resistance-turned-support at 15,500 in today’s trade, signaling that the breakout is more likely legitimate. The RSI is not in overbought territory, signaling the potential for more upside in the short term as long as the key 15,500 level holds.
Source: TradingView, StoneX
FTSE 100 (UK 100) Technical Analysis
Medium-term trend: Up
Key support: 6,800
Key resistance: 7,150
Near-term technical bias: Bullish
Looking at its chart, the UK’s FTSE 100 index is a middle-of-the-road amalgamation of the other indices we’ve examined so far. The medium-term trend is clearly still bullish, with prices holding above their upward-trending 21- and 50-day EMAs and the RSI indicator consolidating after touching overbought territory last month. As with the Dow, the month-to-date sideways consolidation should be viewed as a healthy development for the longer-term trend unless near-term support in the 7,000 is broken, whereas a strong breakout above 7,150 would strengthen the bullish case for a retest of record highs in the upper-7,000s later this year.
Source: TradingView, StoneX
How to trade with FOREX.com
Follow these easy steps to start trading with FOREX.com today:
- Open a Forex.com account, or log-in if you’re already a customer.
- Search for the pair you want to trade in our award-winning platform.
- Choose your position and size, and your stop and limit levels.
- Place the trade.
Latest market news




Open an account in minutes
Experience award-winning platforms with fast and secure execution, and enjoy tight spreads from 0.5 pts on FX and 0.3 pts on indices.
Economic calendar
Web Trader platform
Our sophisticated web-based platform is packed with features.
Related articles

S&P 500 forecast: Stocks extend drop as correction risks grow
US and global equity markets have extended Wednesday’s sell-off, with Wall Street opening lower after a weak handover from Asia and Europe. The deterioration in risk appetite has been spreading across global markets. The dollar was firmer, Treasury yields were holding onto yesterday’s gains, while gold, silver and bitcoin were all under pressure alongside equities and major currencies.


Wall Street Forecast: DJIA falls as treasury yields hit new highs and ahead of the Trump-Xi summit
U.S. stocks are falling, further extending losses from the previous session, as oil prices move higher alongside Treasury yields and caution reigns ahead of the summit between President Trump and Xi Jinping.


Wall Street Forecast: DJIA rises on hawkish Fed expectations & rising yields
U.S. stocks are opening lower on Wednesday, pressured by higher crude oil prices and rising government bond yields, as investors await further developments from negotiations in the Middle East and ahead of a key U.S.-China summit.
This report is intended for general circulation only. It should not be construed as a recommendation, or an offer (or solicitation of an offer) to buy or sell any financial products. The information provided does not take into account your specific investment objectives, financial situation or particular needs. Before you act on any recommendation that may be contained in this report, independent advice ought to be sought from a financial adviser regarding the suitability of the investment product, taking into account your specific investment objectives, financial situation or particular needs.
StoneX Financial Pte. Ltd., may distribute reports produced by its respective foreign entities or affiliates within the StoneX group of companies or third parties pursuant to an arrangement under Regulation 32C of the Financial Advisers Regulations. Where the report is distributed to a person in Singapore who is not an accredited investor, expert investor or an institutional investor (as defined in the Securities Futures Act), StoneX Financial Pte. Ltd. accepts legal responsibility to such persons for the contents of the report only to the extent required by law. Singapore recipients should contact StoneX Financial Pte. Ltd. at 6826 9988 for matters arising from, or in connection with the report.
In the case of all other recipients of this report, to the extent permitted by applicable laws and regulations neither StoneX Financial Pte. Ltd. nor its associated companies will be responsible or liable for any loss or damage incurred arising out of, or in connection with, any use of the information contained in this report and all such liability is hereby expressly disclaimed. No representation or warranty is made, express or implied, that the content of this report is complete or accurate.
StoneX Financial Pte. Ltd. is not under any obligation to update this report.
Trading CFDs carries a high level of risk that may not be suitable for some investors. Consider your investment objectives, level of experience, financial resources, risk appetite and other relevant circumstances carefully. The possibility exists that you could lose some or all of your investments, including your initial deposits. If in doubt, please seek independent expert advice. Visit www.forex.com/en-sg/terms-and-policies for the complete Risk Disclosure Statement.