





Nasdaq 100 forecast boosted by trade optimism as chipmakers lead gains
Something big now has to happen, you’d feel, for the Nasdaq 100 forecast to turn bearish again. Otherwise, continued grind higher, with shallow dips is what I envisage will happen in the days and weeks ahead.
Share this:

- Nasdaq 100 forecast remains modestly bullish amid renewed trade optimism
- Chipmakers rally as Nvidia surges on easing AI export restrictions
- Technical signals suggest this remains a “buy-the-dip” market
The Nasdaq 100 jumped sharply in early Thursday trading, with futures up more than 1% as trade optimism roared back into the spotlight. Much of the cheer came after Nvidia spiked 3.1% late in the day yesterday before adding 1.70% more in pre-market, dragging the rest of the chip sector higher. It wasn’t just a tech party — Europe’s DAX flirted with its all-time high, Bitcoin sprinted towards the $100K milestone, and safe havens like gold and the yen took a backseat. Even the dollar found some footing, logging a third straight week of modest gains. What’s fuelling the recovery in risk? Trade optimism and a well-timed post from Donald Trump, hinting at a “major” trade deal — most likely with the UK — that could be the first of many. Meanwhile, US-China trade talks are back on the calendar this weekend, sparking hope that negotiations are finally gaining traction. Something big now has to happen, you’d feel, for the Nasdaq 100 forecast to turn bearish again. Otherwise, continued grind higher, with shallow dips is what I envisage will happen in the days and weeks ahead.
Market cheers ‘major’ trade deal hype, but is it just smoke?
Let’s be honest: UK-US trade news isn’t usually a market mover — but this time could be different. Some traders are speculating on whether the US might scrap the 10% baseline tariffs, which have been lingering since the so-called "pause" in trade tensions. Most believe those tariffs will stick, partly because Washington might need the revenue to fund upcoming tax cuts. But if the tariffs do come off? That’s a clear upside surprise for risk assets and a fresh bullish twist in the Nasdaq 100 forecast. That said, the real game-changer would be progress with China. And that’s where it gets murky.
US-China talks: hopeful but likely to drag
It is clear the market is already pricing in some level of trade optimism. Sure, headlines say “substantial tariff reductions” are on the table — but without actual deals (outside of the US-UK) inked, it’s hard to justify further upside. The weekend meeting between the US and China feels more like a diplomatic icebreaker than a breakthrough moment. We could be in for a long, drawn-out negotiation season, which may limit the upside potential for risk assets.
Nvidia leads chipmaker charge – but regulation still lurks
Chip stocks got a boost yesterday thanks to chatter that Trump’s team plans to roll back parts of the Biden-era AI chip restrictions. Nvidia surged over 3%, with traders betting on more upside if these rules are eased further. However, the celebration may be premature. The US is also reportedly drafting new restrictions on overseas chip exports — a sign that regulatory uncertainty hasn’t gone away. For now, the Nvidia stock looks like it wants to head back towards the $1.20s range. Let’s see if it gets there and how it performs.
Technical Nasdaq 100 forecast: Key levels to watch
Source: TradingView.com
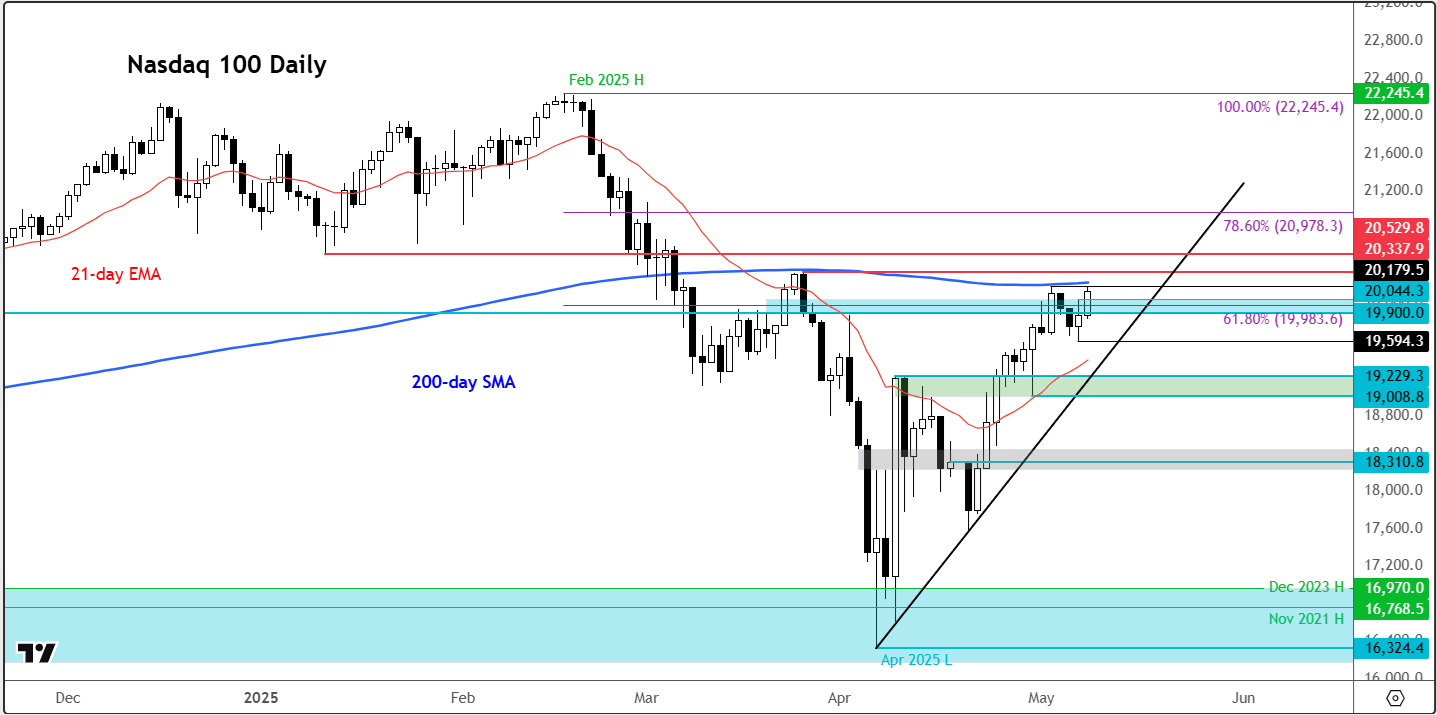
Technically, the Nasdaq 100 remains in bullish territory. The index has reclaimed its 21-day exponential moving average and continues to build a series of interim higher highs and higher lows. As long as we don’t see a convincing bearish reversal pattern, the dip-buying thesis is intact.
Short-term support Levels
- 20,044 – Yesterday’s high; key short-term support
- 19,000 – former support and resistance level
- 19,594 – Yesterday’s low; a break below here might flag a shift in momentum
Short-term resistance levels
- 20,179 – Most recent high, sitting just below the 200-day average
- 20,338 – Resistance from pre-tariff headlines in April
- 20,529 – Old support; now could act as potential cap
-- Written by Fawad Razaqzada, Market Analyst
Follow Fawad on Twitter @Trader_F_R
How to trade with City Index
You can trade with City Index by following these four easy steps:
- Open an account, or log in if you’re already a customer
• Open an account in the UK
• Open an account in Australia
• Open an account in Singapore
- Search for the company you want to trade in our award-winning platform
- Choose your position and size, and your stop and limit levels
- Place the trade
Related tags:


Open an account in minutes
Experience award-winning platforms with fast and secure execution, and enjoy tight spreads from 0.5 pts on FX and 0.3 pts on indices.
Economic calendar
Web Trader platform
Our sophisticated web-based platform is packed with features.
Related articles

Dow Jones forecast: Stock markets under pressure from multiple sources
When looking at the major tech-heavy US indices like the S&P 500 or the Nasdaq 100, you wouldn’t think that the stock market is particularly weak. Yet, beneath the surface, the market is far from healthy right now. Investors are evidently just piling into the big tech and AI names, and as a result, market breadth is deteriorating. Other indices like the small cap Russell 2000 and the Dow Jones are starting to reflect that weakness.

Nikkei breakout accelerates as yen weakness returns
Nikkei has started October with a powerful breakout, helped by renewed yen weakness and strong upside momentum


S&P 500 Forecast: SPX Continues to Drift Away from Record Highs
Recent trading sessions have done little to restore confidence in the equity market. Over the last four sessions, the S&P 500 has declined by nearly 1.00%, a move that highlights growing short-term weakness and keeps the index moving further away from its record-high territory.

This report is intended for general circulation only. It should not be construed as a recommendation, or an offer (or solicitation of an offer) to buy or sell any financial products. The information provided does not take into account your specific investment objectives, financial situation or particular needs. Before you act on any recommendation that may be contained in this report, independent advice ought to be sought from a financial adviser regarding the suitability of the investment product, taking into account your specific investment objectives, financial situation or particular needs.
StoneX Financial Pte. Ltd., may distribute reports produced by its respective foreign entities or affiliates within the StoneX group of companies or third parties pursuant to an arrangement under Regulation 32C of the Financial Advisers Regulations. Where the report is distributed to a person in Singapore who is not an accredited investor, expert investor or an institutional investor (as defined in the Securities Futures Act), StoneX Financial Pte. Ltd. accepts legal responsibility to such persons for the contents of the report only to the extent required by law. Singapore recipients should contact StoneX Financial Pte. Ltd. at 6826 9988 for matters arising from, or in connection with the report.
In the case of all other recipients of this report, to the extent permitted by applicable laws and regulations neither StoneX Financial Pte. Ltd. nor its associated companies will be responsible or liable for any loss or damage incurred arising out of, or in connection with, any use of the information contained in this report and all such liability is hereby expressly disclaimed. No representation or warranty is made, express or implied, that the content of this report is complete or accurate.
StoneX Financial Pte. Ltd. is not under any obligation to update this report.
Trading CFDs carries a high level of risk that may not be suitable for some investors. Consider your investment objectives, level of experience, financial resources, risk appetite and other relevant circumstances carefully. The possibility exists that you could lose some or all of your investments, including your initial deposits. If in doubt, please seek independent expert advice. Visit www.forex.com/en-sg/terms-and-policies for the complete Risk Disclosure Statement.