



Nasdaq 100 forecast: Tech valuation concerns vs. government re-opening optimism
US stock index futures struggled for direction this morning, with traders appearing hesitant after the end of the longest US government shutdown in history. While it’s unclear whether the shutdown was ever a real drag on equities – given that stocks largely rallied through it – the question now is whether the market’s recent exuberance has run its course.
Share this:

- Nasdaq 100 forecast uncertain as tech stocks pause after strong rally
- Traders eye Fed policy clues following government reopening
- Index recently reached a technical exhaustion area
US stock index futures struggled for direction this morning, with traders appearing hesitant after the end of the longest US government shutdown in history. While it’s unclear whether the shutdown was ever a real drag on equities – given that stocks largely rallied through it – the question now is whether the market’s recent exuberance has run its course. After a stellar rally since April, technology shares look increasingly overvalued and overstretched, with sentiment tempered by a lack of fresh catalysts and a lull in economic data. It wouldn’t be surprising to see the Nasdaq 100 remain range-bound in the near term. Yet, it’s far too early to call a top in this cycle, especially with the underlying trend still supported by strong liquidity and investor enthusiasm for AI-driven growth.
Interest rates clarity ahead as US government re-opens
Now that the government has reopened, markets can soon expect the flow of economic data to resume, albeit gradually. According to the White House, October figures, including CPI and payrolls, are unlikely to be released, but November’s data should surface in early December. That leaves traders with continued US data void for a while yet, which means price action could be driven more by sentiment and positioning than by hard data.
The Nasdaq 100 forecast may hinge on how dovish or hawkish the Federal Reserve appears once the data finally rolls in. For now, the market is pricing in around 15 basis points of rate cuts, suggesting investors still see scope for further easing. Any fresh signs of economic slowdown could amplify those bets and provide near-term support to equity valuations.
Tech stocks lose some momentum
Technology stocks, long the poster children of Wall Street’s AI revolution, have started to show signs of fatigue recently. Investors seem increasingly uneasy about just how far, and how fast, the AI narrative has inflated valuations. Over the past few sessions, a noticeable rotation has occurred, with traders moving out of high-growth names and back into defensive and value-oriented sectors.
Is this a sign that risk appetite is fading, or merely the sort of rotation one expects in a healthy bull market? Time will tell. But it’s worth noting that insider selling within the tech space has picked up lately, which rarely bodes well. Traders would do well to stay alert – overconfidence has undone many in markets like these.
Technical Nasdaq 100 forecast and key levels to watch
From a technical perspective, the long-term trend for the Nasdaq 100 forecast remains bullish. However, the index has recently formed a series of lower highs since hitting a near-term exhaustion zone around 25,900–26,250 at the end of October. The lower end of that range coincides with the 161.8% Fibonacci extension of the prior downswing that commenced in February. This particular extension level is used by traders to identify objective profit-target areas, so it often acts as a temporary ceiling.
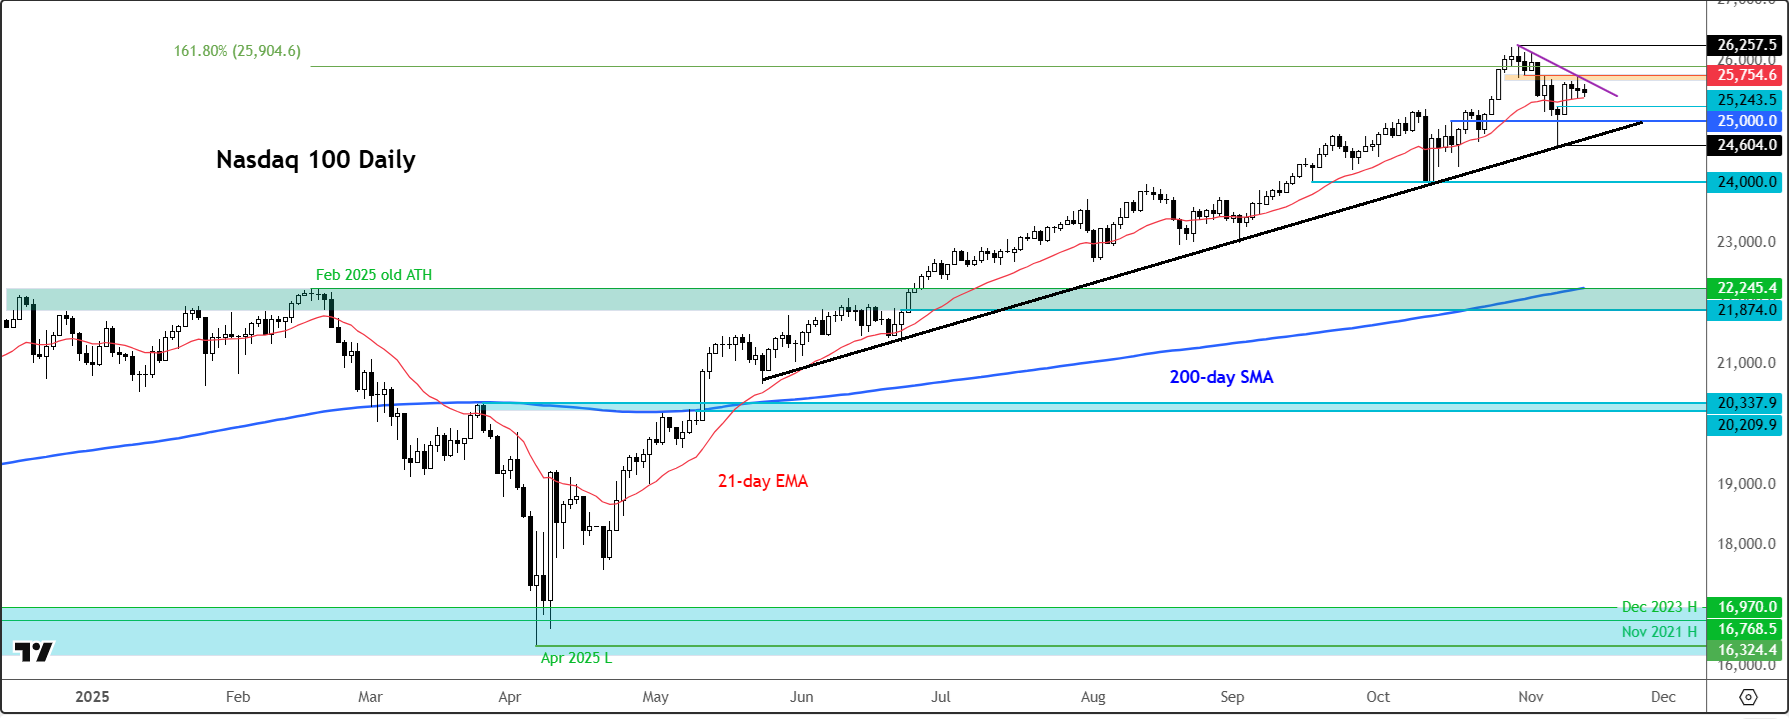
On the downside, the 25,380/25,400 area marks an important short-term support zone on our US tech 100 chart, which is derived from the underlying Nasdaq 100 futures chart. Having held over the past couple of sessions, can we see another bounce here, or will it break down this time? A break below this could open the door to 25,240/5, which represents the top of Friday’s range, when a bullish hammer candle was formed. Beyond that, 24,600 stands out as the key line in the sand—breaching it would confirm a break below the bullish trend line that has been in place since May. Ahead of that, 25,000 serves as a crucial interim psychologically-important support.
On the upside, short-term resistance is seen around 25,750. A move above this band could reawaken bullish momentum and bring the 25,900–26,250 zone back into focus.
In summary, the Nasdaq 100 forecast suggests a market caught between strong underlying optimism and a cooling sense of reality. With tech valuations stretched and Fed expectations still fluid, traders may have to settle for range-bound price action until clearer data—or a fresh catalyst—emerges.

-- Written by Fawad Razaqzada, Market Analyst
Follow Fawad on Twitter @Trader_F_R
Related tags:



Open an account in minutes
Experience award-winning platforms with fast and secure execution, and enjoy tight spreads from 0.5 pts on FX and 0.3 pts on indices.
Economic calendar
Web Trader platform
Our sophisticated web-based platform is packed with features.
Related articles

Gold Outlook: XAU/USD hit hard as US yields, dollar resume ascent
A stronger dollar, surging front-end yields and renewed geopolitical tension have combined to push gold back towards key technical support.


S&P 500, Nasdaq, Dow Forecast: Wall Street Split Widens Into Month-End 9 26 2026
Nasdaq strength contrasts with mounting Dow pressure as rising Treasury yields raise the stakes for stocks heading into the monthly close.


EUR/USD weekly outlook: Oil, inflation and NFP in focus
After coming under significant pressure in recent weeks, the EUR/USD came off its lows to finish the week on a positive note on Friday, albeit with only a mild rebound. That was not enough to prevent the exchange rate falling for the third consecutive week, as the US dollar and bond yields rallied across the board.
This report is intended for general circulation only. It should not be construed as a recommendation, or an offer (or solicitation of an offer) to buy or sell any financial products. The information provided does not take into account your specific investment objectives, financial situation or particular needs. Before you act on any recommendation that may be contained in this report, independent advice ought to be sought from a financial adviser regarding the suitability of the investment product, taking into account your specific investment objectives, financial situation or particular needs.
StoneX Financial Pte. Ltd., may distribute reports produced by its respective foreign entities or affiliates within the StoneX group of companies or third parties pursuant to an arrangement under Regulation 32C of the Financial Advisers Regulations. Where the report is distributed to a person in Singapore who is not an accredited investor, expert investor or an institutional investor (as defined in the Securities Futures Act), StoneX Financial Pte. Ltd. accepts legal responsibility to such persons for the contents of the report only to the extent required by law. Singapore recipients should contact StoneX Financial Pte. Ltd. at 6826 9988 for matters arising from, or in connection with the report.
In the case of all other recipients of this report, to the extent permitted by applicable laws and regulations neither StoneX Financial Pte. Ltd. nor its associated companies will be responsible or liable for any loss or damage incurred arising out of, or in connection with, any use of the information contained in this report and all such liability is hereby expressly disclaimed. No representation or warranty is made, express or implied, that the content of this report is complete or accurate.
StoneX Financial Pte. Ltd. is not under any obligation to update this report.
Trading CFDs carries a high level of risk that may not be suitable for some investors. Consider your investment objectives, level of experience, financial resources, risk appetite and other relevant circumstances carefully. The possibility exists that you could lose some or all of your investments, including your initial deposits. If in doubt, please seek independent expert advice. Visit www.forex.com/en-sg/terms-and-policies for the complete Risk Disclosure Statement.