




NZDUSD on a Tear but for How Much Longer
NZD/USD is up over 2% on the week and its highest level since early August.
Share this:

Over the weekend, New Zealand announced plans to increase infrastructure spending in order to boost growth into 2020. When the markets opened on Monday morning, NZD/USD was shot out of a cannon. Add to that a better than expected NBS China Manufacturing PMI and a better non-official Caixin Manufacturing PMI, and NZD/USD took off. Today is Thursday, and the Kiwi pair hasn’t looked back since! Just today, RBNZ Governor Orr suggested rates are on hold at the next RBNZ meeting in February given the strong data and expected fiscal stimulus over the next year. But is it time for NZD/USD to pause and take a breather?
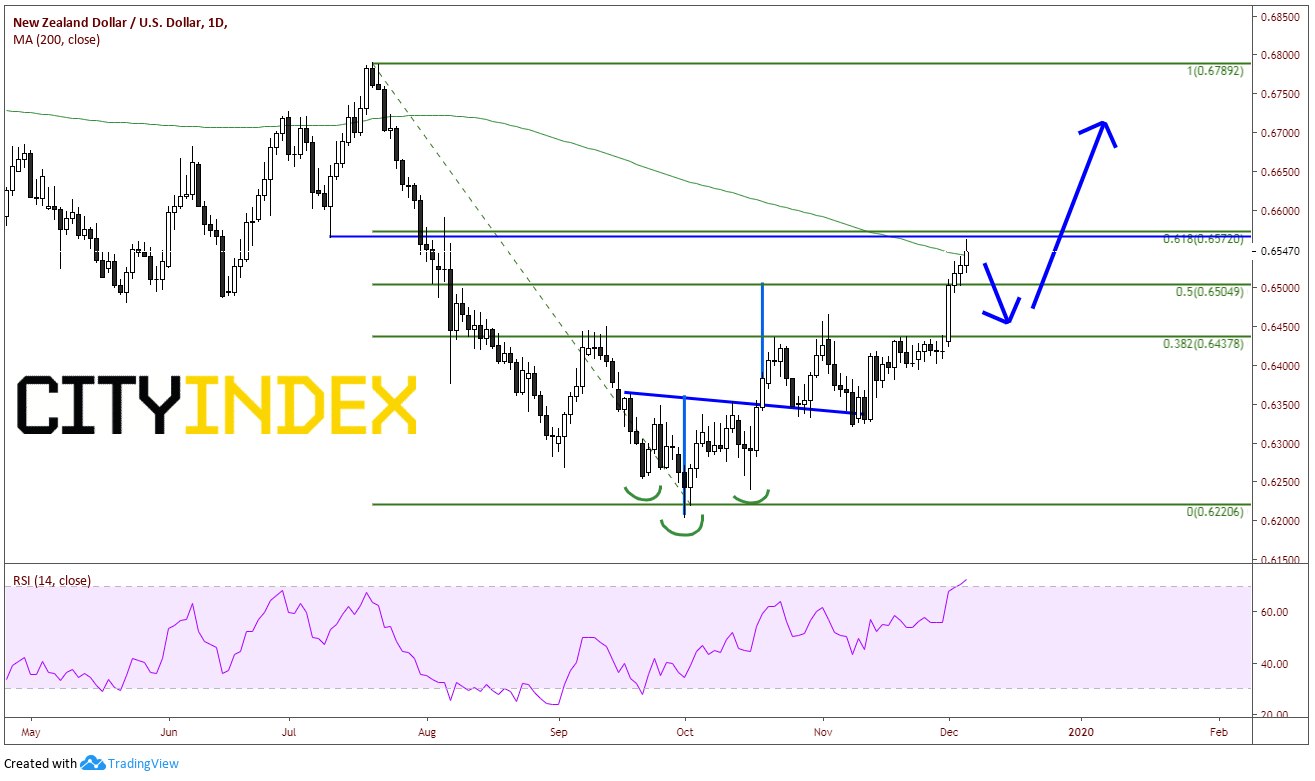
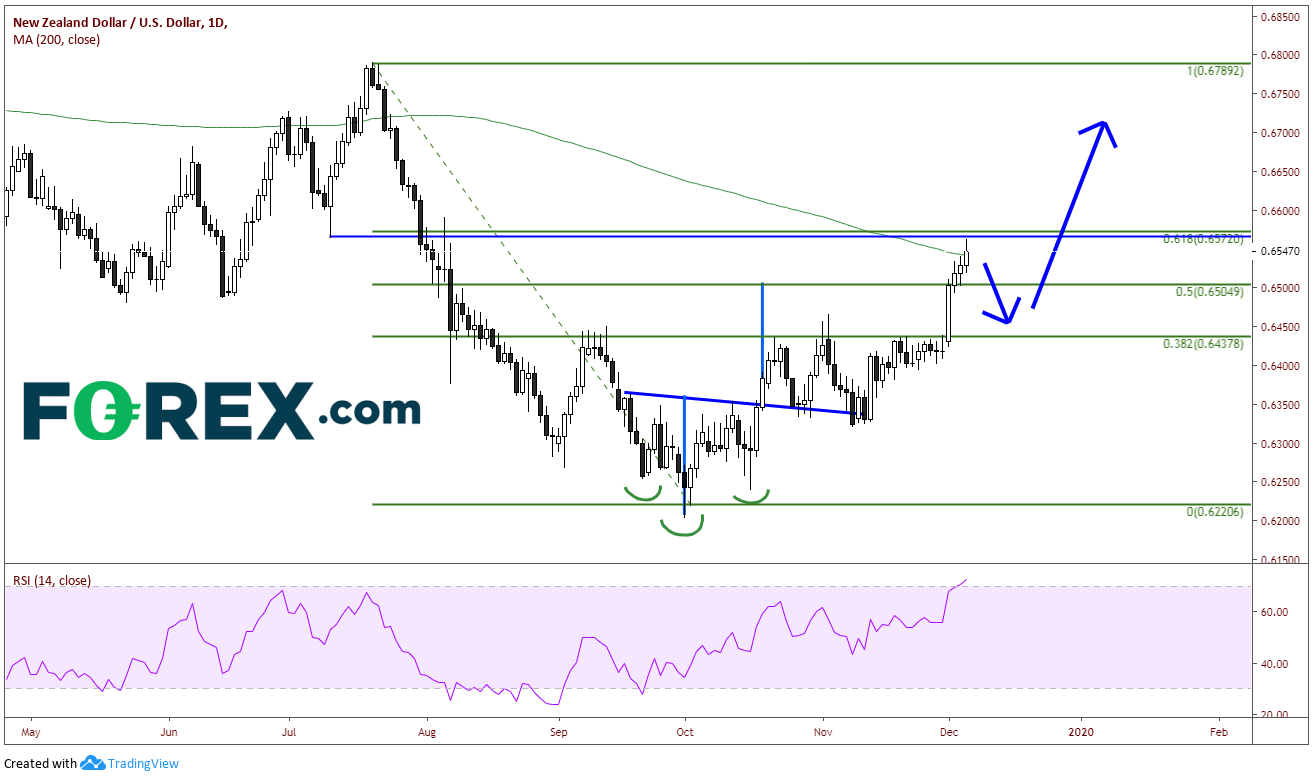
NZD/USD is up over 2% on the week and its highest level since early August. On a daily chart, the pair broke the neckline of its inverse head and shoulders pattern on October 18th, retested it twice, and finally hits the target level on Monday near .6500. This level also coincides with the 50% retracement level from the July 19th high to the October 1st low. NZD/USD pushed right to the Fibonacci retracement 61.8% retracement level of that same timeframe and halted near .6572. This level also coincides with horizontal resistance dating back to July. The pair has pulled back slightly from there on the day and closed at the 200 Day Moving Average near .6545. The RSI on the daily is also at overbought levels. But is this enough for NZD/USD to pull back?
Source: Tradingview, City Index
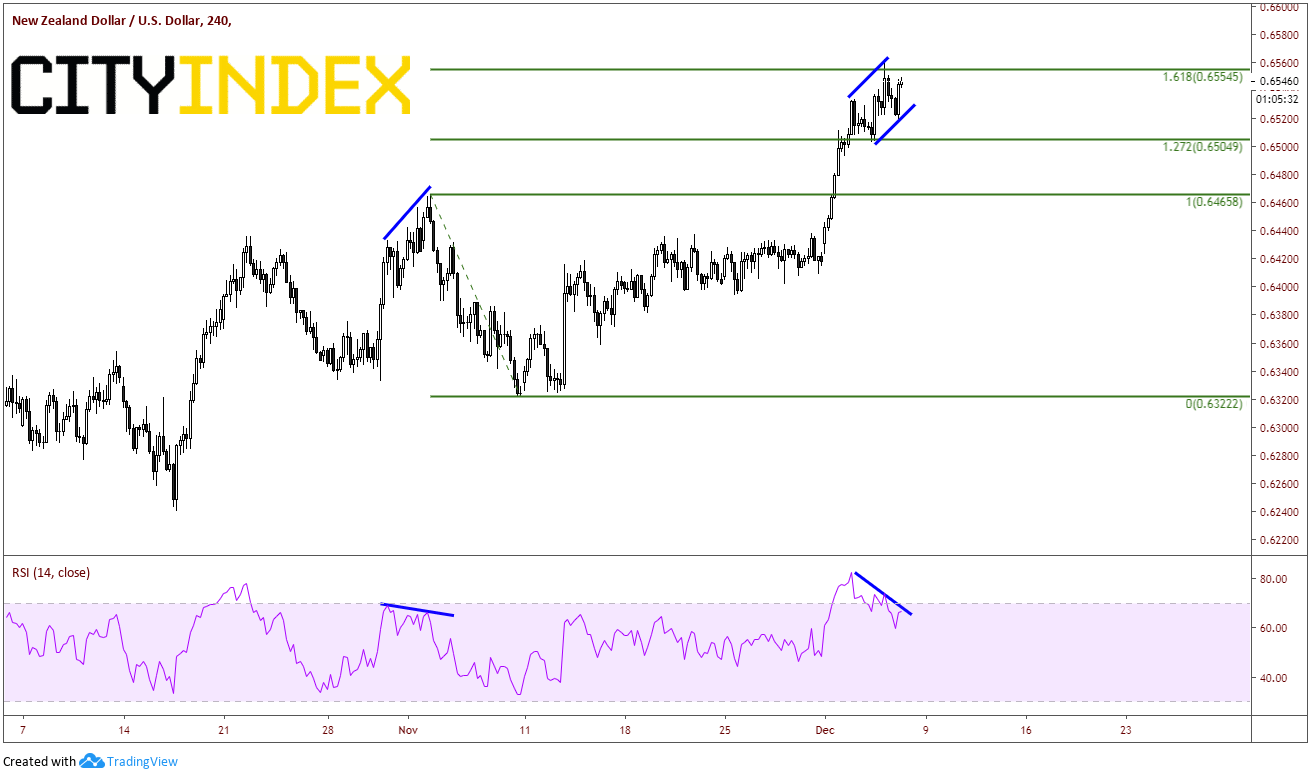
On a shorter 240-minute timeframe, NZD/USD traded up to the 161.8% Golden Fibonacci level from the high on November 4th to the lows of November 8th at .6555. The RSI is also diverging with price from overbought levels. Support comes in at .6500 and then .6458.
Source: Tradingview, City Index
All of this indicates the NZD/USD may be ready for a pullback, possibly on some profit taking, heading into the weekend. Although lately there always to be some kind of positive Friday tweet from US President Trump’s team regarding the US-China trade deal, one must consider if the markets are now immune to these headlines. If the markets no longer care, NZD/USD may be ready to pare its weekly gains.
Over the weekend, New Zealand announced plans to increase infrastructure spending in order to boost growth into 2020. When the markets opened on Monday morning, NZD/USD was shot out of a cannon. Add to that a better than expected NBS China Manufacturing PMI and a better non-official Caixin Manufacturing PMI, and NZD/USD took off. Today is Thursday, and the Kiwi pair hasn’t looked back since! Just today, RBNZ Governor Orr suggested rates are on hold at the next RBNZ meeting in February given the strong data and expected fiscal stimulus over the next year. But is it time for NZD/USD to pause and take a breather?
NZD/USD is up over 2% on the week and its highest level since early August. On a daily chart, the pair broke the neckline of its inverse head and shoulders pattern on October 18th, retested it twice, and finally hits the target level on Monday near .6500. This level also coincides with the 50% retracement level from the July 19th high to the October 1st low. NZD/USD pushed right to the Fibonacci retracement 61.8% retracement level of that same timeframe and halted near .6572. This level also coincides with horizontal resistance dating back to July. The pair has pulled back slightly from there on the day and closed at the 200 Day Moving Average near .6545. The RSI on the daily is also at overbought levels. But is this enough for NZD/USD to pull back?
Source: Tradingview, FOREX.com
On a shorter 240-minute timeframe, NZD/USD traded up to the 161.8% Golden Fibonacci level from the high on November 4th to the lows of November 8th at .6555. The RSI is also diverging with price from overbought levels. Support comes in at .6500 and then .6458.
Source: Tradingview, FOREX.com
All of this indicates the NZD/USD may be ready for a pullback, possibly on some profit taking, heading into the weekend. Although lately there always to be some kind of positive Friday tweet from US President Trump’s team regarding the US-China trade deal, one must consider if the markets are now immune to these headlines. If the markets no longer care, NZD/USD may be ready to pare its weekly gains.
Related tags:


Open an account in minutes
Experience award-winning platforms with fast and secure execution, and enjoy tight spreads from 0.5 pts on FX and 0.3 pts on indices.
Economic calendar
Web Trader platform
Our sophisticated web-based platform is packed with features.
Related articles
Japanese Yen Forecast: USD/JPY 4% Rally Challenges Post-Intervention Downtrend 9 24 2026
USD/JPY momentum has shifted sharply higher, putting a major resistance confluence in focus as U.S. and Japanese event risk builds.

Oil Quietly Hands the Fed a Reason to Stay Hawkish
Oil prices and the U.S. dollar are both on the front foot as elevated energy costs feed Fed warnings that inflation may prove sticky.


USD/JPY outlook: Hawkish Fed recalibration pressures the yen
Stronger US growth momentum and rising Treasury yields are keeping USD/JPY pointed higher, even as Japanese policymakers try to limit the pressure building across domestic markets.

This report is intended for general circulation only. It should not be construed as a recommendation, or an offer (or solicitation of an offer) to buy or sell any financial products. The information provided does not take into account your specific investment objectives, financial situation or particular needs. Before you act on any recommendation that may be contained in this report, independent advice ought to be sought from a financial adviser regarding the suitability of the investment product, taking into account your specific investment objectives, financial situation or particular needs.
StoneX Financial Pte. Ltd., may distribute reports produced by its respective foreign entities or affiliates within the StoneX group of companies or third parties pursuant to an arrangement under Regulation 32C of the Financial Advisers Regulations. Where the report is distributed to a person in Singapore who is not an accredited investor, expert investor or an institutional investor (as defined in the Securities Futures Act), StoneX Financial Pte. Ltd. accepts legal responsibility to such persons for the contents of the report only to the extent required by law. Singapore recipients should contact StoneX Financial Pte. Ltd. at 6826 9988 for matters arising from, or in connection with the report.
In the case of all other recipients of this report, to the extent permitted by applicable laws and regulations neither StoneX Financial Pte. Ltd. nor its associated companies will be responsible or liable for any loss or damage incurred arising out of, or in connection with, any use of the information contained in this report and all such liability is hereby expressly disclaimed. No representation or warranty is made, express or implied, that the content of this report is complete or accurate.
StoneX Financial Pte. Ltd. is not under any obligation to update this report.
Trading CFDs carries a high level of risk that may not be suitable for some investors. Consider your investment objectives, level of experience, financial resources, risk appetite and other relevant circumstances carefully. The possibility exists that you could lose some or all of your investments, including your initial deposits. If in doubt, please seek independent expert advice. Visit www.forex.com/en-sg/terms-and-policies for the complete Risk Disclosure Statement.