



Reading the risk barometer SP500
With month-end rebalancing flows now underway that often lead to whippy and unpredictable moves in FX markets and the month of June shortly upon us, we take this opportunity to update our view of the S&P500, the preferred barometer of risk sentiment. As things stand currently, the S&P500 is on track to register a gain of almost 5% during May - consolidating and building upon its impressive 13% rally in April.
Share this:

With month-end rebalancing flows now underway that often lead to whippy and unpredictable moves in FX markets and the month of June shortly upon us, we take this opportunity to update our view of the S&P500, the preferred barometer of risk sentiment.
As things stand currently, the S&P500 is on track to register a gain of almost 5% during May - consolidating and building upon its impressive 13% rally in April.
In terms of the drivers behind Mays rally, central bank activity and rhetoric have remained ultra-supportive. Trials indicate a coronavirus vaccine might be available sooner than expected. Also at play, an encouraging re-opening of economies, that marks April as a trough for growth.
Not to mention an ability to shake off a worrying escalation in Sino-U.S tensions over the coronavirus and Hong Kong as well as a the shackles of the historically weak month of May.
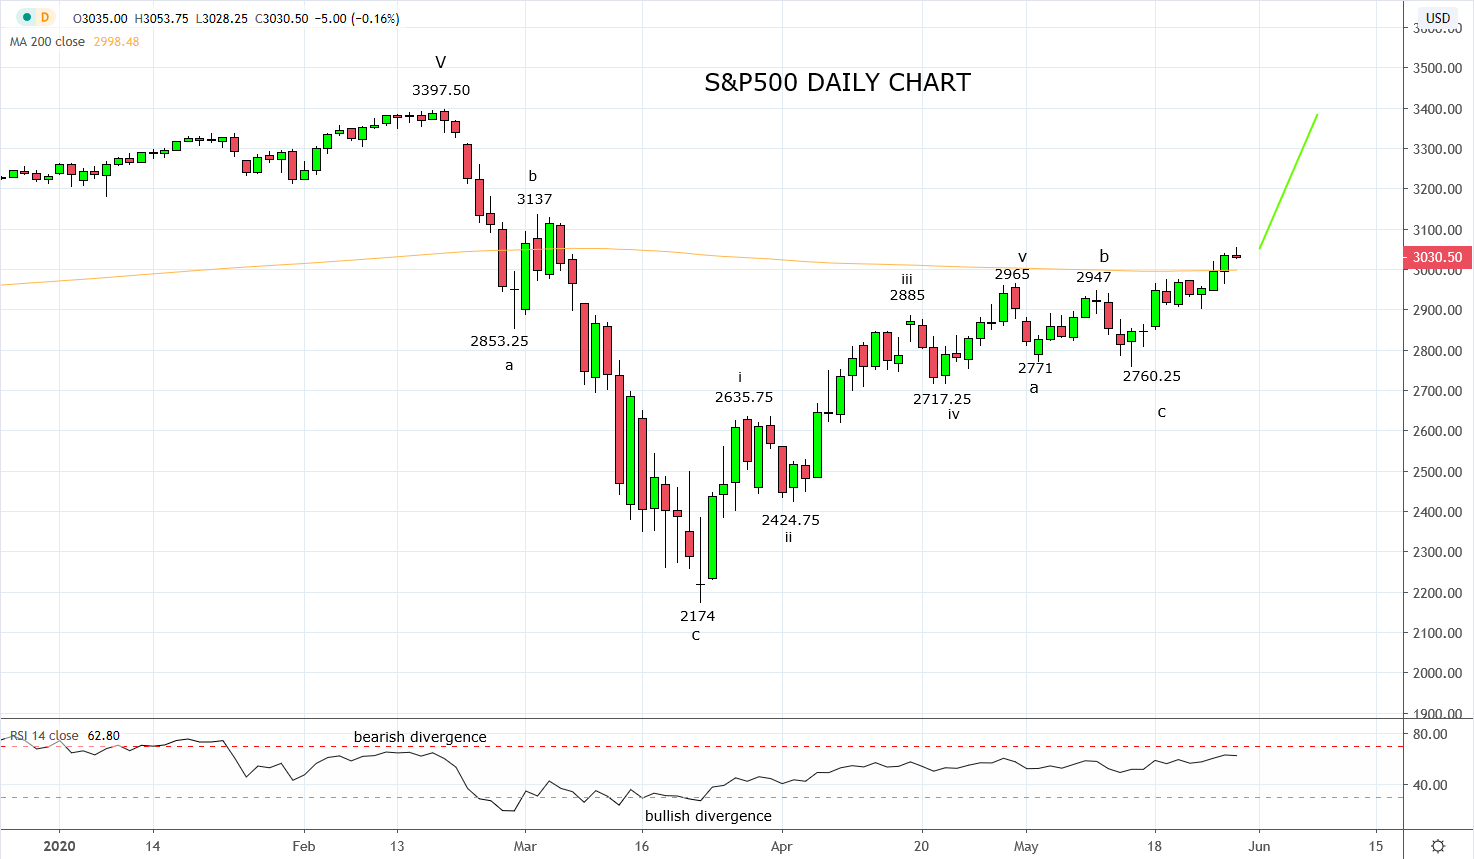
In our last article on the S&P500 at the end of April here we concluded that the appearance of a five-wave from the March 2174 low to the April 2965 high, signalled the uptrend had resumed and should soon be followed by a corrective pullback.
“Keep in mind that after this five wave rally is completed, a pullback is likely before the uptrend resumes. In this context, our preference in coming weeks is to buy countertrend/corrective pullbacks, looking for a retest and break of year to date highs.”
The pullback to the May 2760.25 low unfolded in three waves and fits nicely within the countertrend/corrective roadmap outlined above. This week’s break to new highs was a positive development and also the minimum requirement following the completion of the correction.
Providing the S&P500 can now post a second consecutive daily close above the 200 day moving average at 3000, it would indicate that the next leg higher towards the layer of resistance near the March 3137 high is underway, with scope then towards the all-time high of 3397.50.
Keeping in mind, should the S&P500 fail to post a second consecutive daily close above 3000 and then close back below near term support 2965/45 (from recent highs), it would suggest the bullish move has lost traction and risks a return back towards the layer of medium-term support ahead of 2720.
Source Tradingview. The figures stated areas of the 28th of May 2020. Past performance is not a reliable indicator of future performance. This report does not contain and is not to be taken as containing any financial product advice or financial product recommendation
Related tags:
Latest market news




Open an account in minutes
Experience award-winning platforms with fast and secure execution, and enjoy tight spreads from 0.5 pts on FX and 0.3 pts on indices.
Economic calendar
Web Trader platform
Our sophisticated web-based platform is packed with features.
Related articles
Equity Indices Q4, 2026 Outlook: Cracks Begin to Show
There's still an open door for a melt-up in the S&P 500 and Nasdaq but the Dow and Russell 2000 are looking more vulnerable, and until calm hits the Treasuries market there's a higher probability for volatility. The big question is whether that's a next quarter theme or not.

S&P 500 Forecast: SPX rises as oil prices fall, but treasuries remain at multi-decade highs
U.S. stocks are rising on Friday after a volatile week that saw a surge in Treasury yields ripple through financial markets.

S&P 500 forecast: Stocks extend drop as correction risks grow
US and global equity markets have extended Wednesday’s sell-off, with Wall Street opening lower after a weak handover from Asia and Europe. The deterioration in risk appetite has been spreading across global markets. The dollar was firmer, Treasury yields were holding onto yesterday’s gains, while gold, silver and bitcoin were all under pressure alongside equities and major currencies.
This report is intended for general circulation only. It should not be construed as a recommendation, or an offer (or solicitation of an offer) to buy or sell any financial products. The information provided does not take into account your specific investment objectives, financial situation or particular needs. Before you act on any recommendation that may be contained in this report, independent advice ought to be sought from a financial adviser regarding the suitability of the investment product, taking into account your specific investment objectives, financial situation or particular needs.
StoneX Financial Pte. Ltd., may distribute reports produced by its respective foreign entities or affiliates within the StoneX group of companies or third parties pursuant to an arrangement under Regulation 32C of the Financial Advisers Regulations. Where the report is distributed to a person in Singapore who is not an accredited investor, expert investor or an institutional investor (as defined in the Securities Futures Act), StoneX Financial Pte. Ltd. accepts legal responsibility to such persons for the contents of the report only to the extent required by law. Singapore recipients should contact StoneX Financial Pte. Ltd. at 6826 9988 for matters arising from, or in connection with the report.
In the case of all other recipients of this report, to the extent permitted by applicable laws and regulations neither StoneX Financial Pte. Ltd. nor its associated companies will be responsible or liable for any loss or damage incurred arising out of, or in connection with, any use of the information contained in this report and all such liability is hereby expressly disclaimed. No representation or warranty is made, express or implied, that the content of this report is complete or accurate.
StoneX Financial Pte. Ltd. is not under any obligation to update this report.
Trading CFDs carries a high level of risk that may not be suitable for some investors. Consider your investment objectives, level of experience, financial resources, risk appetite and other relevant circumstances carefully. The possibility exists that you could lose some or all of your investments, including your initial deposits. If in doubt, please seek independent expert advice. Visit www.forex.com/en-sg/terms-and-policies for the complete Risk Disclosure Statement.