




Risk Rally Pauses For Breath ECB in Focus
Share this:

Wall Street ended in the green, with the Nasdaq briefly touching levels last seen pre-coronavirus, in February and just short of its all-time high. The optimism spilled into Asia overnight, where fresh two month highs were reached. However, risk tone is struggling for direction heading into the European open, as investors await the ECB monetary policy meeting.
Gradual easing of lockdown measures and optimism surrounding the reopening of economies, combined with government and central bank stimulus has seen risk appetite soar. Stocks continue to trade at levels which appear at odds with the data which is coming through.
The S&P is trading just 3% down this year and the Dax 5%. These figures seem almost unbelievable given the horrendous data which is revealing the extent of the damage that the coronavirus crisis has inflicted on economies across the globe. It almost seems absurd that US stock indices can be trading at these levels whilst the unemployment running close to levels last seen the great depression of the 1930’s
Worst behind us & low expectations beaten
However, a good portion of this data is beating forecasts. Just yesterday, service sector PMI data across Europe, UK and the US beat expectations, even though activity remains deep in contraction. US ADP data showed that only 2 million US private sector jobs were lost, well down from the 9 million forecast and 25 million from April. A classic example of if you set the bar low enough anything is a positive.
However, a good portion of this data is beating forecasts. Just yesterday, service sector PMI data across Europe, UK and the US beat expectations, even though activity remains deep in contraction. US ADP data showed that only 2 million US private sector jobs were lost, well down from the 9 million forecast and 25 million from April. A classic example of if you set the bar low enough anything is a positive.
There is a clear sense that the worst is in the rear-view mirror. Combine this optimism with government and central bank stimulus, and the expectation that more stimulus is coming the rally is more comprehensible.
German stimulus, Dax soars
Angela Merkel didn’t disappoint yesterday, announcing an additional €130 billion stimulus package to help Germany recover from the coronavirus crisis, adding to an initial shot of stimulus in March. The announcement came as the unemployment rate hit its highest level since late 2015.
Angela Merkel didn’t disappoint yesterday, announcing an additional €130 billion stimulus package to help Germany recover from the coronavirus crisis, adding to an initial shot of stimulus in March. The announcement came as the unemployment rate hit its highest level since late 2015.
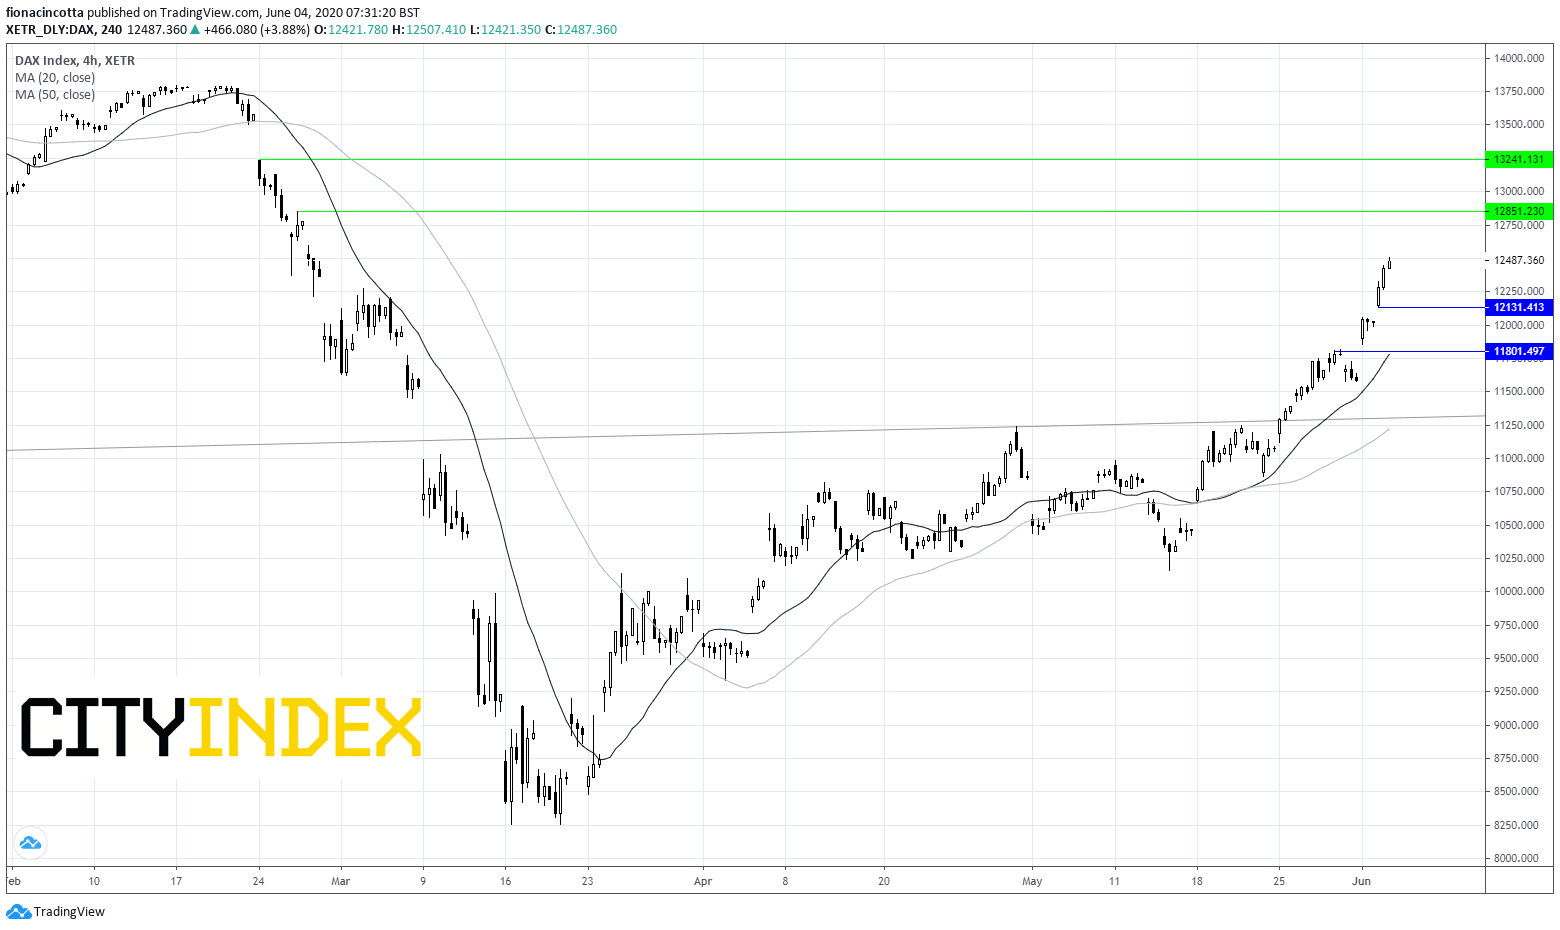
The Dax rallied 3.8% in the previous session, gaining just shy of 7% so far in June. The index is down just 5% so far this year, highlighting the under performance of the FTSE, which still trades some 15% off its levels at the start of the year.
ECB to expand PEPP
Attention will now turn to the ECB, which is expected to keep rates on hold. However, there is a growing expectation that the central bank will expand their bond purchasing programme, the Pandemic Emergency Purchase Programme.
The €750 billion programme, aimed to support those nations hardest hit by the coronavirus crisis, is set to run out in October. Expectations are for the programme to be expanded by €250 billion - €500 billion and the timeline pushed out beyond October. However, with expectations riding so high, the biggest risk here is that the ECB do nothing and wait further data.
ECB staff projections will also be closely watched and are expected to make for pretty grim reading. GDP contraction in the region of 8-12% is expected.
Dax levels to watch:
The Dax trades above its 100, 50 & 20 sma on 4 hour chart, a strongly bullish chart. The index also trades above its long term trend line dating back to October 2011.
Immediate resistance can be seen at 12850 (high 26th Feb) prior to 13240 (high 24th Feb).
Support can be seen at 12133 (low 2nd June) prior to 11810 (high 28th May).
Wall Street ended in the green, with the Nasdaq briefly touching levels last seen pre-coronavirus, in February and just short of its all-time high. The optimism spilled into Asia overnight, where fresh two month highs were reached. However, risk tone is struggling for direction heading into the European open, as investors await the ECB monetary policy meeting.
Gradual easing of lockdown measures and optimism surrounding the reopening of economies, combined with government and central bank stimulus has seen risk appetite soar. Stocks continue to trade at levels which appear at odds with the data which is coming through.
The S&P is trading just 3% down this year and the Dax 5%. These figures seem almost unbelievable given the horrendous data which is revealing the extent of the damage that the coronavirus crisis has inflicted on economies across the globe. It almost seems absurd that US stock indices can be trading at these levels whilst the unemployment running close to levels last seen the great depression of the 1930’s
Worst behind us & low expectations beaten
However, a good portion of this data is beating forecasts. Just yesterday, service sector PMI data across Europe, UK and the US beat expectations, even though activity remains deep in contraction. US ADP data showed that only 2 million US private sector jobs were lost, well down from the 9 million forecast and 25 million from April. A classic example of if you set the bar low enough anything is a positive.
However, a good portion of this data is beating forecasts. Just yesterday, service sector PMI data across Europe, UK and the US beat expectations, even though activity remains deep in contraction. US ADP data showed that only 2 million US private sector jobs were lost, well down from the 9 million forecast and 25 million from April. A classic example of if you set the bar low enough anything is a positive.
There is a clear sense that the worst is in the rear-view mirror. Combine this optimism with government and central bank stimulus, and the expectation that more stimulus is coming the rally is more comprehensible.
German stimulus, Dax soars
Angela Merkel didn’t disappoint yesterday, announcing an additional €130 billion stimulus package to help Germany recover from the coronavirus crisis, adding to an initial shot of stimulus in March. The announcement came as the unemployment rate hit its highest level since late 2015.
Angela Merkel didn’t disappoint yesterday, announcing an additional €130 billion stimulus package to help Germany recover from the coronavirus crisis, adding to an initial shot of stimulus in March. The announcement came as the unemployment rate hit its highest level since late 2015.
The Dax rallied 3.8% in the previous session, gaining just shy of 7% so far in June. The index is down just 5% so far this year, highlighting the under performance of the FTSE, which still trades some 15% off its levels at the start of the year.
ECB to expand PEPP
Attention will now turn to the ECB, which is expected to keep rates on hold. However, there is a growing expectation that the central bank will expand their bond purchasing programme, the Pandemic Emergency Purchase Programme.
The €750 billion programme, aimed to support those nations hardest hit by the coronavirus crisis, is set to run out in October. Expectations are for the programme to be expanded by €250 billion - €500 billion and the timeline pushed out beyond October. However, with expectations riding so high, the biggest risk here is that the ECB do nothing and wait further data.
ECB staff projections will also be closely watched and are expected to make for pretty grim reading. GDP contraction in the region of 8-12% is expected.
Dax levels to watch:
The Dax trades above its 100, 50 & 20 sma on 4 hour chart, a strongly bullish chart. The index also trades above its long term trend line dating back to October 2011.
Immediate resistance can be seen at 12850 (high 26th Feb) prior to 13240 (high 24th Feb).
Support can be seen at 12133 (low 2nd June) prior to 11810 (high 28th May).
Related tags:
Latest market news




Open an account in minutes
Experience award-winning platforms with fast and secure execution, and enjoy tight spreads from 0.5 pts on FX and 0.3 pts on indices.
Economic calendar
Web Trader platform
Our sophisticated web-based platform is packed with features.
Related articles

S&P 500 forecast: Stocks extend drop as correction risks grow
US and global equity markets have extended Wednesday’s sell-off, with Wall Street opening lower after a weak handover from Asia and Europe. The deterioration in risk appetite has been spreading across global markets. The dollar was firmer, Treasury yields were holding onto yesterday’s gains, while gold, silver and bitcoin were all under pressure alongside equities and major currencies.

ASX 200 Rebound Stalls Despite Wall Street Surge
The ASX 200 rebound is struggling for traction despite a powerful Wall Street rally, leaving 8800 resistance and downside risks in focus.


Nikkei threatens breakout as tech rebound broadens
Breakouts across the SOX and Nasdaq are being matched by rebounds across Asia, with the Nikkei now threatening to join the move.

This report is intended for general circulation only. It should not be construed as a recommendation, or an offer (or solicitation of an offer) to buy or sell any financial products. The information provided does not take into account your specific investment objectives, financial situation or particular needs. Before you act on any recommendation that may be contained in this report, independent advice ought to be sought from a financial adviser regarding the suitability of the investment product, taking into account your specific investment objectives, financial situation or particular needs.
StoneX Financial Pte. Ltd., may distribute reports produced by its respective foreign entities or affiliates within the StoneX group of companies or third parties pursuant to an arrangement under Regulation 32C of the Financial Advisers Regulations. Where the report is distributed to a person in Singapore who is not an accredited investor, expert investor or an institutional investor (as defined in the Securities Futures Act), StoneX Financial Pte. Ltd. accepts legal responsibility to such persons for the contents of the report only to the extent required by law. Singapore recipients should contact StoneX Financial Pte. Ltd. at 6826 9988 for matters arising from, or in connection with the report.
In the case of all other recipients of this report, to the extent permitted by applicable laws and regulations neither StoneX Financial Pte. Ltd. nor its associated companies will be responsible or liable for any loss or damage incurred arising out of, or in connection with, any use of the information contained in this report and all such liability is hereby expressly disclaimed. No representation or warranty is made, express or implied, that the content of this report is complete or accurate.
StoneX Financial Pte. Ltd. is not under any obligation to update this report.
Trading CFDs carries a high level of risk that may not be suitable for some investors. Consider your investment objectives, level of experience, financial resources, risk appetite and other relevant circumstances carefully. The possibility exists that you could lose some or all of your investments, including your initial deposits. If in doubt, please seek independent expert advice. Visit www.forex.com/en-sg/terms-and-policies for the complete Risk Disclosure Statement.