






S&P 500 outlook: Correction risks growing - Technical Tuesday
Stocks have not responded in the usual way of cheering on weaker-than-expected data. The questions, are we finally headed for a long overdue correction now? The S&P 500 outlook is not bearish yet from a technical viewpoint, but the potential is there for that to change in the coming days.
Share this:

The ongoing sell-off in crude oil has had negative implications for other commodities, with copper and silver both dropping further lower, and that in turn has caused some commodity stocks to extend their falls. Demand concerns have been intensified by weak US factory data we saw on Monday, which again showed activity in the sector fell in contraction unexpectedly. Today’s JOLTS data showed easing demand for labour, pointing to a weakening jobs market. While the data has caused bond yields to fall, this has been offset by concerns over economic and earnings growth. Thus, stocks have not responded in the usual way of cheering on weaker-than-expected data. The questions, are we finally headed for a long overdue correction now? The S&P 500 outlook is not bearish yet from a technical viewpoint, but the potential is there for that to change in the coming days.
S&P 500 outlook: technical factors and levels to watch
Source: TradingView.com
The bullish trend is losing its strength with the S&P 500 moving into consolidation mode after the recent upsurge to a new record high above April’s peak of 5277 was met with some profit-taking pressure. The trend is not bearish yet but has the potential to turn that way should we see the breakdown of a few important support levels. Friday’s big recovery and rally should have led to some follow-up technical buying, but instead we have seen the S&P drift lower from around 5296 resistance level. So far, support at 5250 has held firm, but a closing break below it today could make things interesting heading into the middle and business end of the week.
If we do see further weakening signs today, then watch out for a sharp move lower to take out trapped traders whose stops would be resting below Friday’s large bullish engulfing candle, at 5191. The next short-term level to watch below that is at 5122, which was the high point of April before the breakout in early May.
In terms of resistance, 5296 appears to be a key short-term obstacle. Above here, 5326 is the next potential resistance then there is nothing significant until May’s all-time high at just below 5350.
S&P 500 outlook: why are stocks struggling?
Adding to the above-mentioned concerns about the economy, investors are also happy to book profit ahead of a busy week for economic events. Risk appetite is also waning amid a lack of major fresh bullish catalysts. People are happy to book profits after what has been a strong year so far in the tech sector. We have also seen some insider selling in big tech firms like Nvidia, which one cannot ignore. For months, the stock market rally has been driven by strong demand for technology shares, bolstering indices like the Nasdaq 100 and S&P 500 despite weaknesses in other sectors. However, technology shares now appear overextended, so a correction may be on the horizon. After months of substantial gains and no new bullish catalysts, even the bullish camp would welcome a bit of a downward movement in stock prices to make them attractive again.
Markets face key test with top tier data releases
Thanks to consistently weak manufacturing data from around the world, demand concerns are the forefront of investors’ minds. This week is packed with significant data releases. Key US macroeconomic indicators to watch include the ISM Services PMI, ADP private payrolls, and jobless claims data. However, the main focus is on Friday when the May jobs report will be published.
Today's highlight was the JOLTS Job Openings, which came in below the expected 8.40 million. Instead, it printed 8.06 million, down from a revised 8.36 million (initially reported 8.49 million) the previous month, indicating a potential softening of the labour market. Meanwhile the RCM/TIPP Economic Optimism index fell to 40.5 from 41.8, missing expectations of an improvement to 45.2.
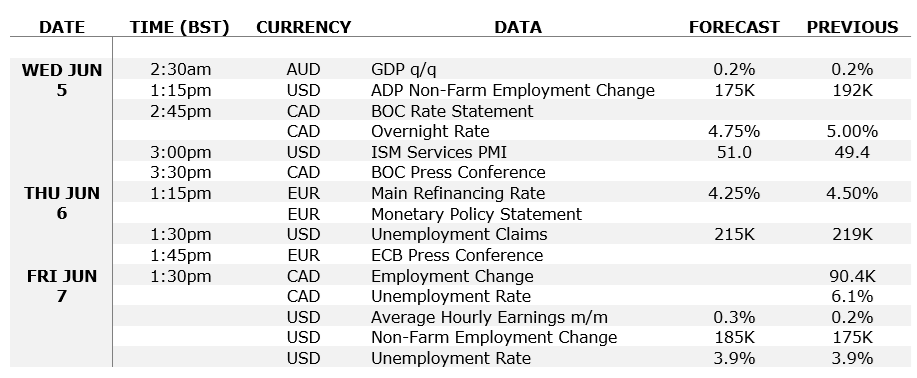
Here’s the full list of key data releases to watch on the economic calendar this week:
-- Written by Fawad Razaqzada, Market Analyst
Follow Fawad on Twitter @Trader_F_R
How to trade with City Index
You can trade with City Index by following these four easy steps:
- Open an account, or log in if you’re already a customer
• Open an account in the UK
• Open an account in Australia
• Open an account in Singapore
- Search for the company you want to trade in our award-winning platform
- Choose your position and size, and your stop and limit levels
- Place the trade
Related tags:
Latest market news



Open an account in minutes
Experience award-winning platforms with fast and secure execution, and enjoy tight spreads from 0.5 pts on FX and 0.3 pts on indices.
Economic calendar
Web Trader platform
Our sophisticated web-based platform is packed with features.
Related articles
EUR/USD weekly outlook: Oil, inflation and NFP in focus
After coming under significant pressure in recent weeks, the EUR/USD came off its lows to finish the week on a positive note on Friday, albeit with only a mild rebound. That was not enough to prevent the exchange rate falling for the third consecutive week, as the US dollar and bond yields rallied across the board.
Gold Q4 2026 outlook: Resilience in the face of rallying dollar and yields
As we headed towards the latter stages of Q3 and into Q4, the Fed had just hiked rates in a hawkish FOMC meeting, while the likes of the ECB and BoJ had also tightened their respective policies. Oil prices remained elevated amid the prolonged US-Iran conflict. Meanwhile, bond yields were breaking out, and the dollar was higher across the board. Yet, remarkably, gold was still holding in the positive territory for the third quarter, even if it had weakened somewhat in September.

Oil Quietly Hands the Fed a Reason to Stay Hawkish
Oil prices and the U.S. dollar are both on the front foot as elevated energy costs feed Fed warnings that inflation may prove sticky.
This report is intended for general circulation only. It should not be construed as a recommendation, or an offer (or solicitation of an offer) to buy or sell any financial products. The information provided does not take into account your specific investment objectives, financial situation or particular needs. Before you act on any recommendation that may be contained in this report, independent advice ought to be sought from a financial adviser regarding the suitability of the investment product, taking into account your specific investment objectives, financial situation or particular needs.
StoneX Financial Pte. Ltd., may distribute reports produced by its respective foreign entities or affiliates within the StoneX group of companies or third parties pursuant to an arrangement under Regulation 32C of the Financial Advisers Regulations. Where the report is distributed to a person in Singapore who is not an accredited investor, expert investor or an institutional investor (as defined in the Securities Futures Act), StoneX Financial Pte. Ltd. accepts legal responsibility to such persons for the contents of the report only to the extent required by law. Singapore recipients should contact StoneX Financial Pte. Ltd. at 6826 9988 for matters arising from, or in connection with the report.
In the case of all other recipients of this report, to the extent permitted by applicable laws and regulations neither StoneX Financial Pte. Ltd. nor its associated companies will be responsible or liable for any loss or damage incurred arising out of, or in connection with, any use of the information contained in this report and all such liability is hereby expressly disclaimed. No representation or warranty is made, express or implied, that the content of this report is complete or accurate.
StoneX Financial Pte. Ltd. is not under any obligation to update this report.
Trading CFDs carries a high level of risk that may not be suitable for some investors. Consider your investment objectives, level of experience, financial resources, risk appetite and other relevant circumstances carefully. The possibility exists that you could lose some or all of your investments, including your initial deposits. If in doubt, please seek independent expert advice. Visit www.forex.com/en-sg/terms-and-policies for the complete Risk Disclosure Statement.