



Seasonals Suggest A Lower Vix For September
After a bumpy ride throughout August, perhaps volatility can subside and present us with a more directional move once traders return to their desks.
Share this:

It's been a volatile month for markets, with the fallout from the ongoing trade war, attacks on the Fed, Brexit and Italian elections (to name a few rivers). This may feel counter to how markets ‘should be’ during the lazy summer periods yet, according to the seasonality for VIX, it appears to be on track for a typical summer month.
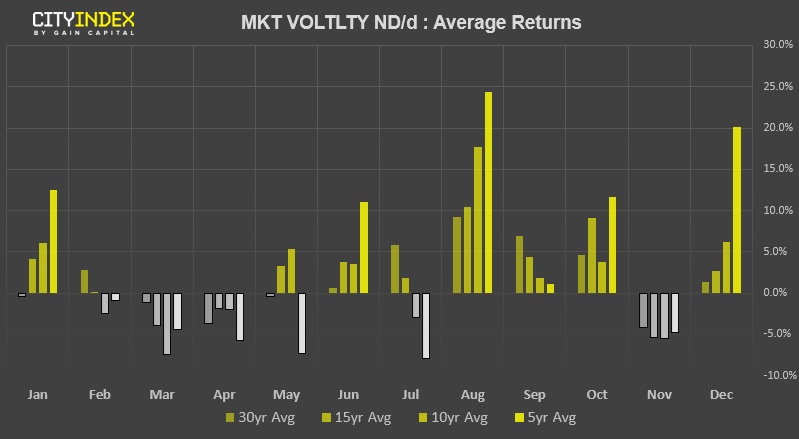
Taking the past 30 years of data, we can see that the VIX is typically higher during the month of August. Moreover, the average has increased if we measure over the past 5, 10 and 15 years. Whilst each August will have its own tale to tell, it can partly rationalised to a lower liquidity environment which can leave markets (such as the S&P500) more vulnerable to large moves from perhaps smaller headlines.
Looking forward, we can see that the level of VIX typically lowers during September as traders return to their desks. In turn, this could suggest we’re in for a period of dull, sideways trading or (hopefully) lower volatility at the beginning of new trends amid a more liquid market. Of course, time will tell, but it’ something to consider moving forward (and whilst the S&P500 remains rangebound).
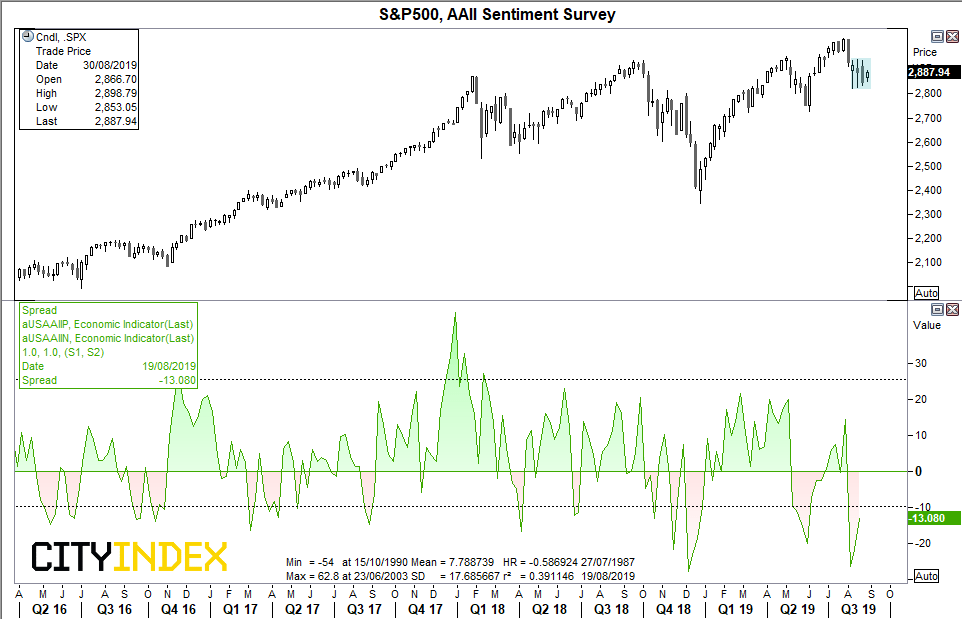
It’s possible we may not see the S&P500 break out of range until traders (and therefore volumes) return, so traders could look to buy at the lows or short at the highs. However, we’ve noticed that the AAII Sentiment Survey (American Association of Individual Investors) has signalled a bearish extreme earlier this month. As with most sentiment indicators, timing can be off, but looking back through history shows that extremely low readings can occur some time around the actual price low, give or take a few weeks. The indicator is the spread between bullish and bearish investors, and the dotted lines represent +/1 1 standard deviation. And, given we’ve seen the yield curve invert which has historically been bullish for the S&P500, perhaps traders will want to enter long when they return from their break. As always, let price action be your guide.
Related analysis:
Forward Returns Following A US10-2 Year Inversion
It's been a volatile month for markets, with the fallout from the ongoing trade war, attacks on the Fed, Brexit and Italian elections (to name a few rivers). This may feel counter to how markets ‘should be’ during the lazy summer periods yet, according to the seasonality for VIX, it appears to be on track for a typical summer month.
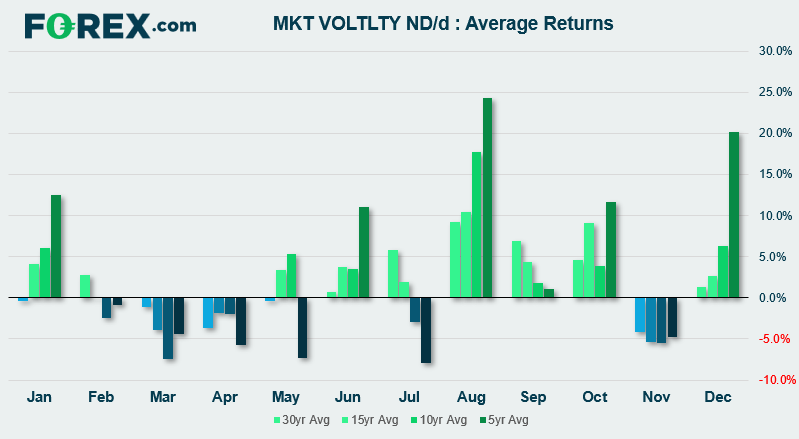
Taking the past 30 years of data, we can see that the VIX is typically higher during the month of August. Moreover, the average has increased if we measure over the past 5, 10 and 15 years. Whilst each August will have its own tale to tell, it can partly rationalised to a lower liquidity environment which can leave markets (such as the S&P500) more vulnerable to large moves from perhaps smaller headlines.
Looking forward, we can see that the level of VIX typically lowers during September as traders return to their desks. In turn, this could suggest we’re in for a period of dull, sideways trading or (hopefully) lower volatility at the beginning of new trends amid a more liquid market. Of course, time will tell, but it’ something to consider moving forward (and whilst the S&P500 remains rangebound).
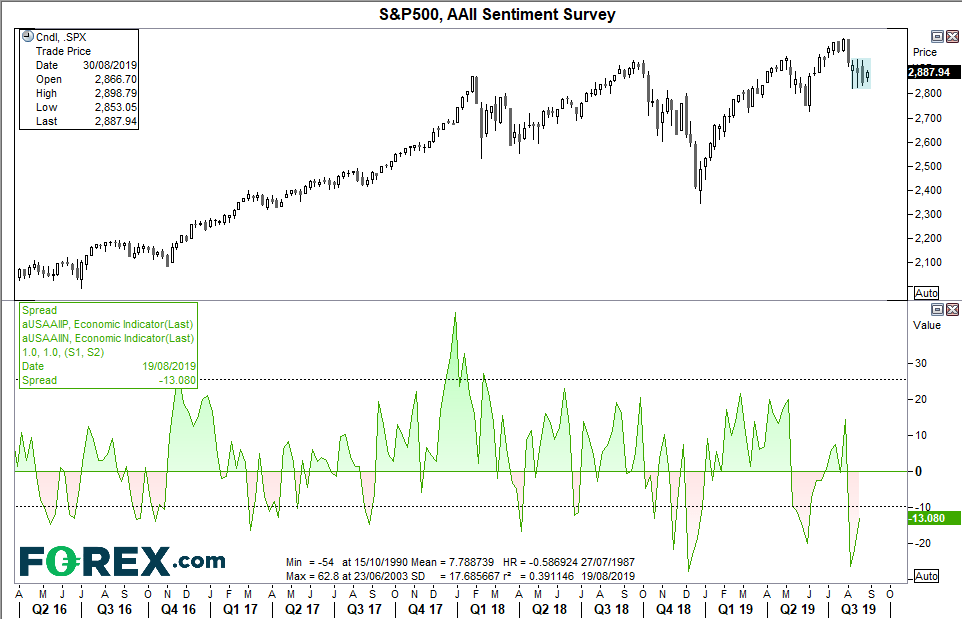
It’s possible we may not see the S&P500 break out of range until traders (and therefore volumes) return, so traders could look to buy at the lows or short at the highs. However, we’ve noticed that the AAII Sentiment Survey (American Association of Individual Investors) has signalled a bearish extreme earlier this month. As with most sentiment indicators, timing can be off, but looking back through history shows that extremely low readings can occur some time around the actual price low, give or take a few weeks. The indicator is the spread between bullish and bearish investors, and the dotted lines represent +/1 1 standard deviation. And, given we’ve seen the yield curve invert which has historically been bullish for the S&P500, perhaps traders will want to enter long when they return from their break. As always, let price action be your guide.
Related analysis:
Forward Returns Following A US10-2 Year Inversion
Two Scenarios We're Watching On The Dax
Related tags:
Latest market news




Open an account in minutes
Experience award-winning platforms with fast and secure execution, and enjoy tight spreads from 0.5 pts on FX and 0.3 pts on indices.
Economic calendar
Web Trader platform
Our sophisticated web-based platform is packed with features.
Related articles

RBA delivers 25bp hike, Bullock now the main event
The RBA delivered the expected 25bp hike, but Bullock’s press conference now looms as the bigger volatility risk for AUD/USD and the ASX 200.


S&P 500 forecast: Stocks extend drop as correction risks grow
US and global equity markets have extended Wednesday’s sell-off, with Wall Street opening lower after a weak handover from Asia and Europe. The deterioration in risk appetite has been spreading across global markets. The dollar was firmer, Treasury yields were holding onto yesterday’s gains, while gold, silver and bitcoin were all under pressure alongside equities and major currencies.


ASX 200 Rebound Stalls Despite Wall Street Surge
The ASX 200 rebound is struggling for traction despite a powerful Wall Street rally, leaving 8800 resistance and downside risks in focus.

This report is intended for general circulation only. It should not be construed as a recommendation, or an offer (or solicitation of an offer) to buy or sell any financial products. The information provided does not take into account your specific investment objectives, financial situation or particular needs. Before you act on any recommendation that may be contained in this report, independent advice ought to be sought from a financial adviser regarding the suitability of the investment product, taking into account your specific investment objectives, financial situation or particular needs.
StoneX Financial Pte. Ltd., may distribute reports produced by its respective foreign entities or affiliates within the StoneX group of companies or third parties pursuant to an arrangement under Regulation 32C of the Financial Advisers Regulations. Where the report is distributed to a person in Singapore who is not an accredited investor, expert investor or an institutional investor (as defined in the Securities Futures Act), StoneX Financial Pte. Ltd. accepts legal responsibility to such persons for the contents of the report only to the extent required by law. Singapore recipients should contact StoneX Financial Pte. Ltd. at 6826 9988 for matters arising from, or in connection with the report.
In the case of all other recipients of this report, to the extent permitted by applicable laws and regulations neither StoneX Financial Pte. Ltd. nor its associated companies will be responsible or liable for any loss or damage incurred arising out of, or in connection with, any use of the information contained in this report and all such liability is hereby expressly disclaimed. No representation or warranty is made, express or implied, that the content of this report is complete or accurate.
StoneX Financial Pte. Ltd. is not under any obligation to update this report.
Trading CFDs carries a high level of risk that may not be suitable for some investors. Consider your investment objectives, level of experience, financial resources, risk appetite and other relevant circumstances carefully. The possibility exists that you could lose some or all of your investments, including your initial deposits. If in doubt, please seek independent expert advice. Visit www.forex.com/en-sg/terms-and-policies for the complete Risk Disclosure Statement.