



Silver Outshines Gold’s Recovery
Silver Outlook: Gold’s recovery remains capped below the 4,150 resistance, while silver continues to extend its rebound, eyeing the 52 barrier. The question now is whether silver will set a new resistance or clear the path for a fresh breakout
Share this:

Key Events
- Nasdaq and gold lag below 25,700 and 4,150 as Dow and silver approach record highs near 48,000 and 52.
- Key resistance levels are now in sight, likely to define whether precious metals experience another drop or a breakthrough as we move toward year-end.
Silver & Gold Outlook: Daily Time Frame – Log Scale
Source: Tradingview
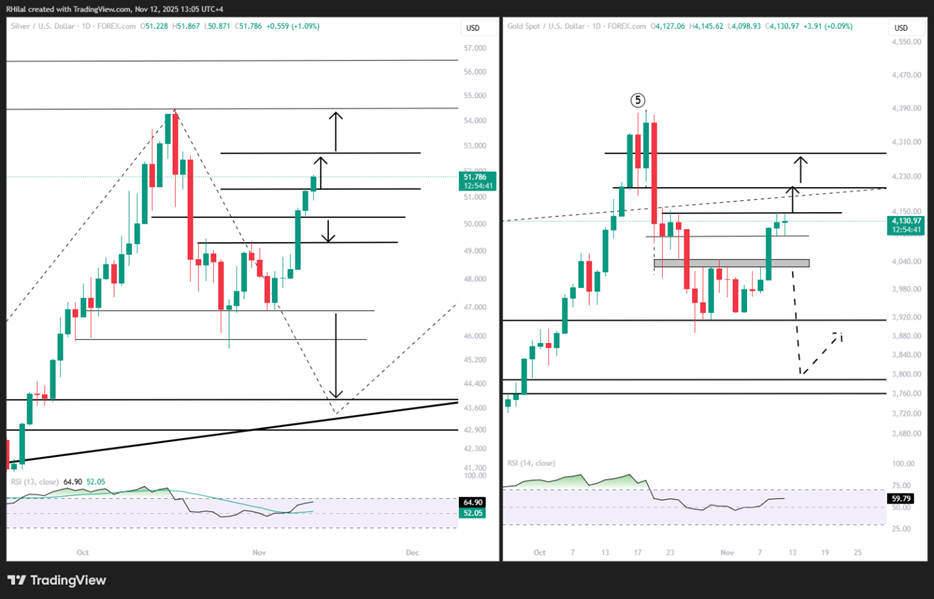
On the daily time frame, silver is maintaining a steeper and more consistent recovery than gold, eyeing the 52 level and record highs. Gold, by contrast, remains capped below the 4,150 resistance, giving silver the relative strength advantage and potential confirmation lead.
Previously, when silver reached its record near 54.30, gold was still consolidating below 4,380, signaling a possible topping pattern for silver ahead of gold.
However, if both metals manage to break through their respective resistance levels, another bullish phase could unfold for the year, with silver eyeing the $60 range and gold potentially redirecting its trend toward $5,000.
The following scenarios stand out:
Silver Outlook: Daily Time Frame – Log Scale
Source: Tradingview
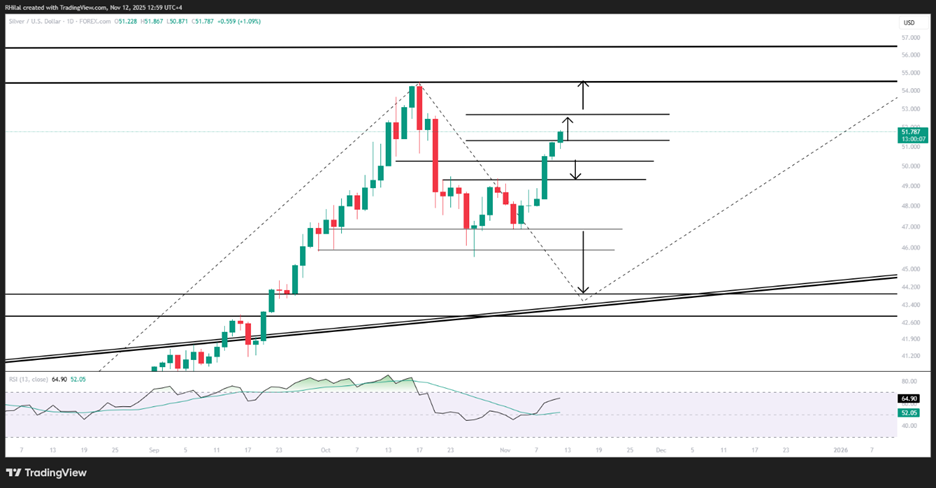
Silver continues to recover steadily from the 45.50 low, advancing toward the 52 mark. Key resistance levels remain at 52.00, 52.17, and the 54.30 record high.
A sustained close above these levels could redirect the broader trend toward new records, with potential targets near 57.00 and 63.80, based on longer-term weekly chart structures.
Despite this strength, the current rebound may still represent a corrective phase within a broader precious metals consolidation following the 2025 rally.
Short-term support zones are observed near 51.30, 50.30, and 49.30. A renewed dip below 49.30 could reintroduce the risk of a deeper correction toward the 44–42 zone before a more definitive recovery takes hold.
Silver Outlook: Weekly Time Frame – Log Scale
Source: Tradingview
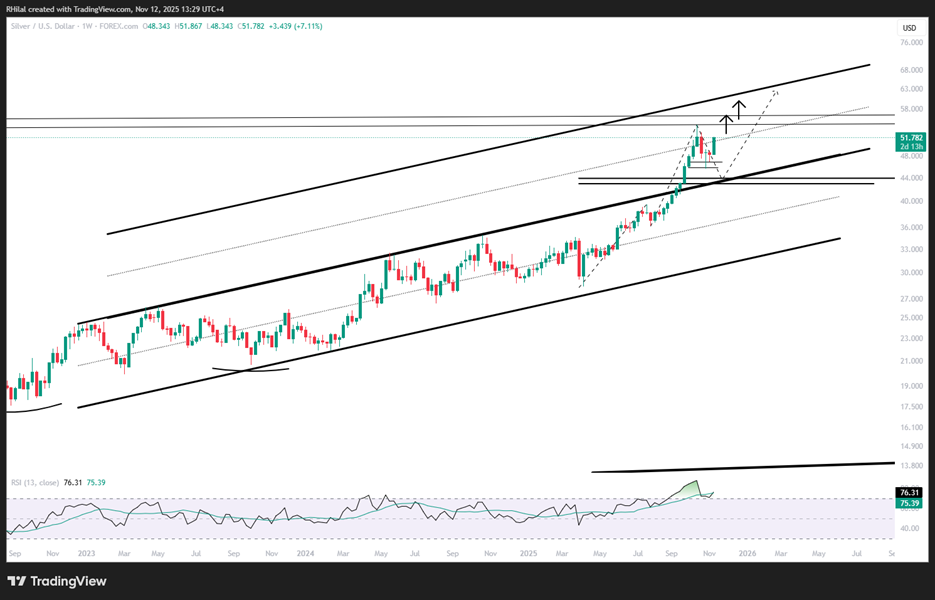
From a weekly perspective, silver’s price action remains decisively above a parallel channel extending from 2023. If another decline occurs below 49.30 and 45.00, the long-term critical support zone lies between 44.30 and 42.90. This region aligns with the trendline connecting consecutive higher highs from 2023 to 2024 and corresponds to the 0.236 Fibonacci retracement of the broader uptrend between the 2022 trough at 17.55 and the 2025 peak at 54.30.
On the upside, a sustained hold above the mid-zone of the duplicated channel and the yearly high at 54.30 could fuel further gains toward the upper boundary of the channel, with targets at 57.00 and 63.80, respectively.
Long-Term Structure: 45-Year Pattern, 3-Month Time Frame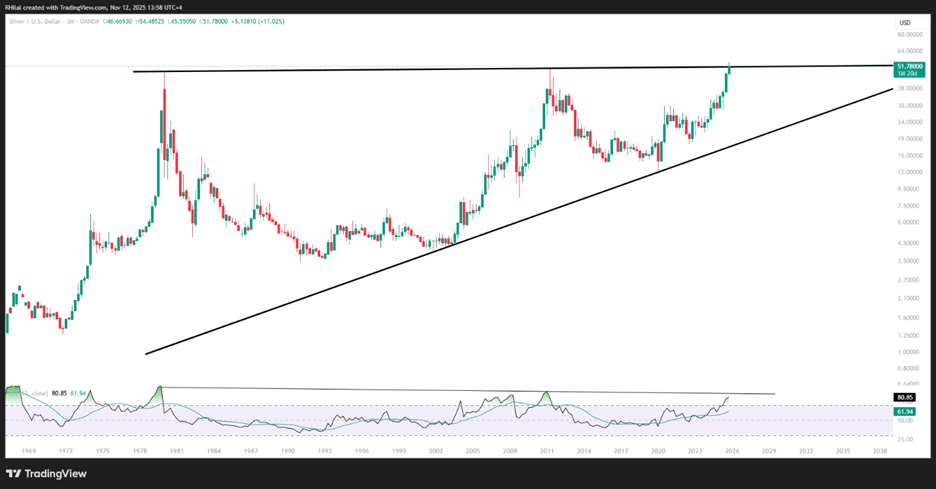
Source: Tradingview
The significance of the 2025 high in silver lies in its alignment with a 45-year resistance trendline extending from the 1980s.
A monthly close above the 54.30 record would mark a decisive breakout beyond this multi-decade structure, potentially extending silver’s trajectory toward triple-digit levels — possibly outpacing gold — as global industrial demand and technological innovation continue to expand silver’s strategic role.
Written by Razan Hilal, CMT
Follow on X: @Rh_waves
Related tags:
Latest market news




Open an account in minutes
Experience award-winning platforms with fast and secure execution, and enjoy tight spreads from 0.5 pts on FX and 0.3 pts on indices.
Economic calendar
Web Trader platform
Our sophisticated web-based platform is packed with features.
Related articles
Japanese Yen Forecast: USD/JPY 4% Rally Challenges Post-Intervention Downtrend 9 24 2026
USD/JPY momentum has shifted sharply higher, putting a major resistance confluence in focus as U.S. and Japanese event risk builds.

GBP/USD, DJIA Outlook: Support Levels Meet Oversold Risks
GBP/USD and the Dow test key support levels as rising Treasury yields, Fed rate-hike expectations and oversold momentum increase reversal risks.

Gold forecast: XAU/USD could take a larger dive after the big rise in yields
Gold prices have been falling in the last few days after last week’s post-FOMC pop faded amid rising interest rate expectations, higher oil prices and a strengthening US dollar. As before, I wasn’t convinced gold would thrive in the current macro backdrop.

This report is intended for general circulation only. It should not be construed as a recommendation, or an offer (or solicitation of an offer) to buy or sell any financial products. The information provided does not take into account your specific investment objectives, financial situation or particular needs. Before you act on any recommendation that may be contained in this report, independent advice ought to be sought from a financial adviser regarding the suitability of the investment product, taking into account your specific investment objectives, financial situation or particular needs.
StoneX Financial Pte. Ltd., may distribute reports produced by its respective foreign entities or affiliates within the StoneX group of companies or third parties pursuant to an arrangement under Regulation 32C of the Financial Advisers Regulations. Where the report is distributed to a person in Singapore who is not an accredited investor, expert investor or an institutional investor (as defined in the Securities Futures Act), StoneX Financial Pte. Ltd. accepts legal responsibility to such persons for the contents of the report only to the extent required by law. Singapore recipients should contact StoneX Financial Pte. Ltd. at 6826 9988 for matters arising from, or in connection with the report.
In the case of all other recipients of this report, to the extent permitted by applicable laws and regulations neither StoneX Financial Pte. Ltd. nor its associated companies will be responsible or liable for any loss or damage incurred arising out of, or in connection with, any use of the information contained in this report and all such liability is hereby expressly disclaimed. No representation or warranty is made, express or implied, that the content of this report is complete or accurate.
StoneX Financial Pte. Ltd. is not under any obligation to update this report.
Trading CFDs carries a high level of risk that may not be suitable for some investors. Consider your investment objectives, level of experience, financial resources, risk appetite and other relevant circumstances carefully. The possibility exists that you could lose some or all of your investments, including your initial deposits. If in doubt, please seek independent expert advice. Visit www.forex.com/en-sg/terms-and-policies for the complete Risk Disclosure Statement.