






S&P 500 Analysis: Conflicting signals arise just off its all-time high
The S&P 500 cash market settled just 4 points from its all-time high. Yet a reversal candle and unfavourable market positioning send a warning to bulls, yet recent history suggest this setup could be bullish.
Share this:

- The S&P 500 is less than 4-points from its record high
- While a bearish reversal candle has formed, recent history shows similar scenarios to be bullish
- Yet asset managers are stepping away from their aggressively bullish exposure
- My bias is for near-term gains while keeping a watchful eye on market positioning in the coming weeks
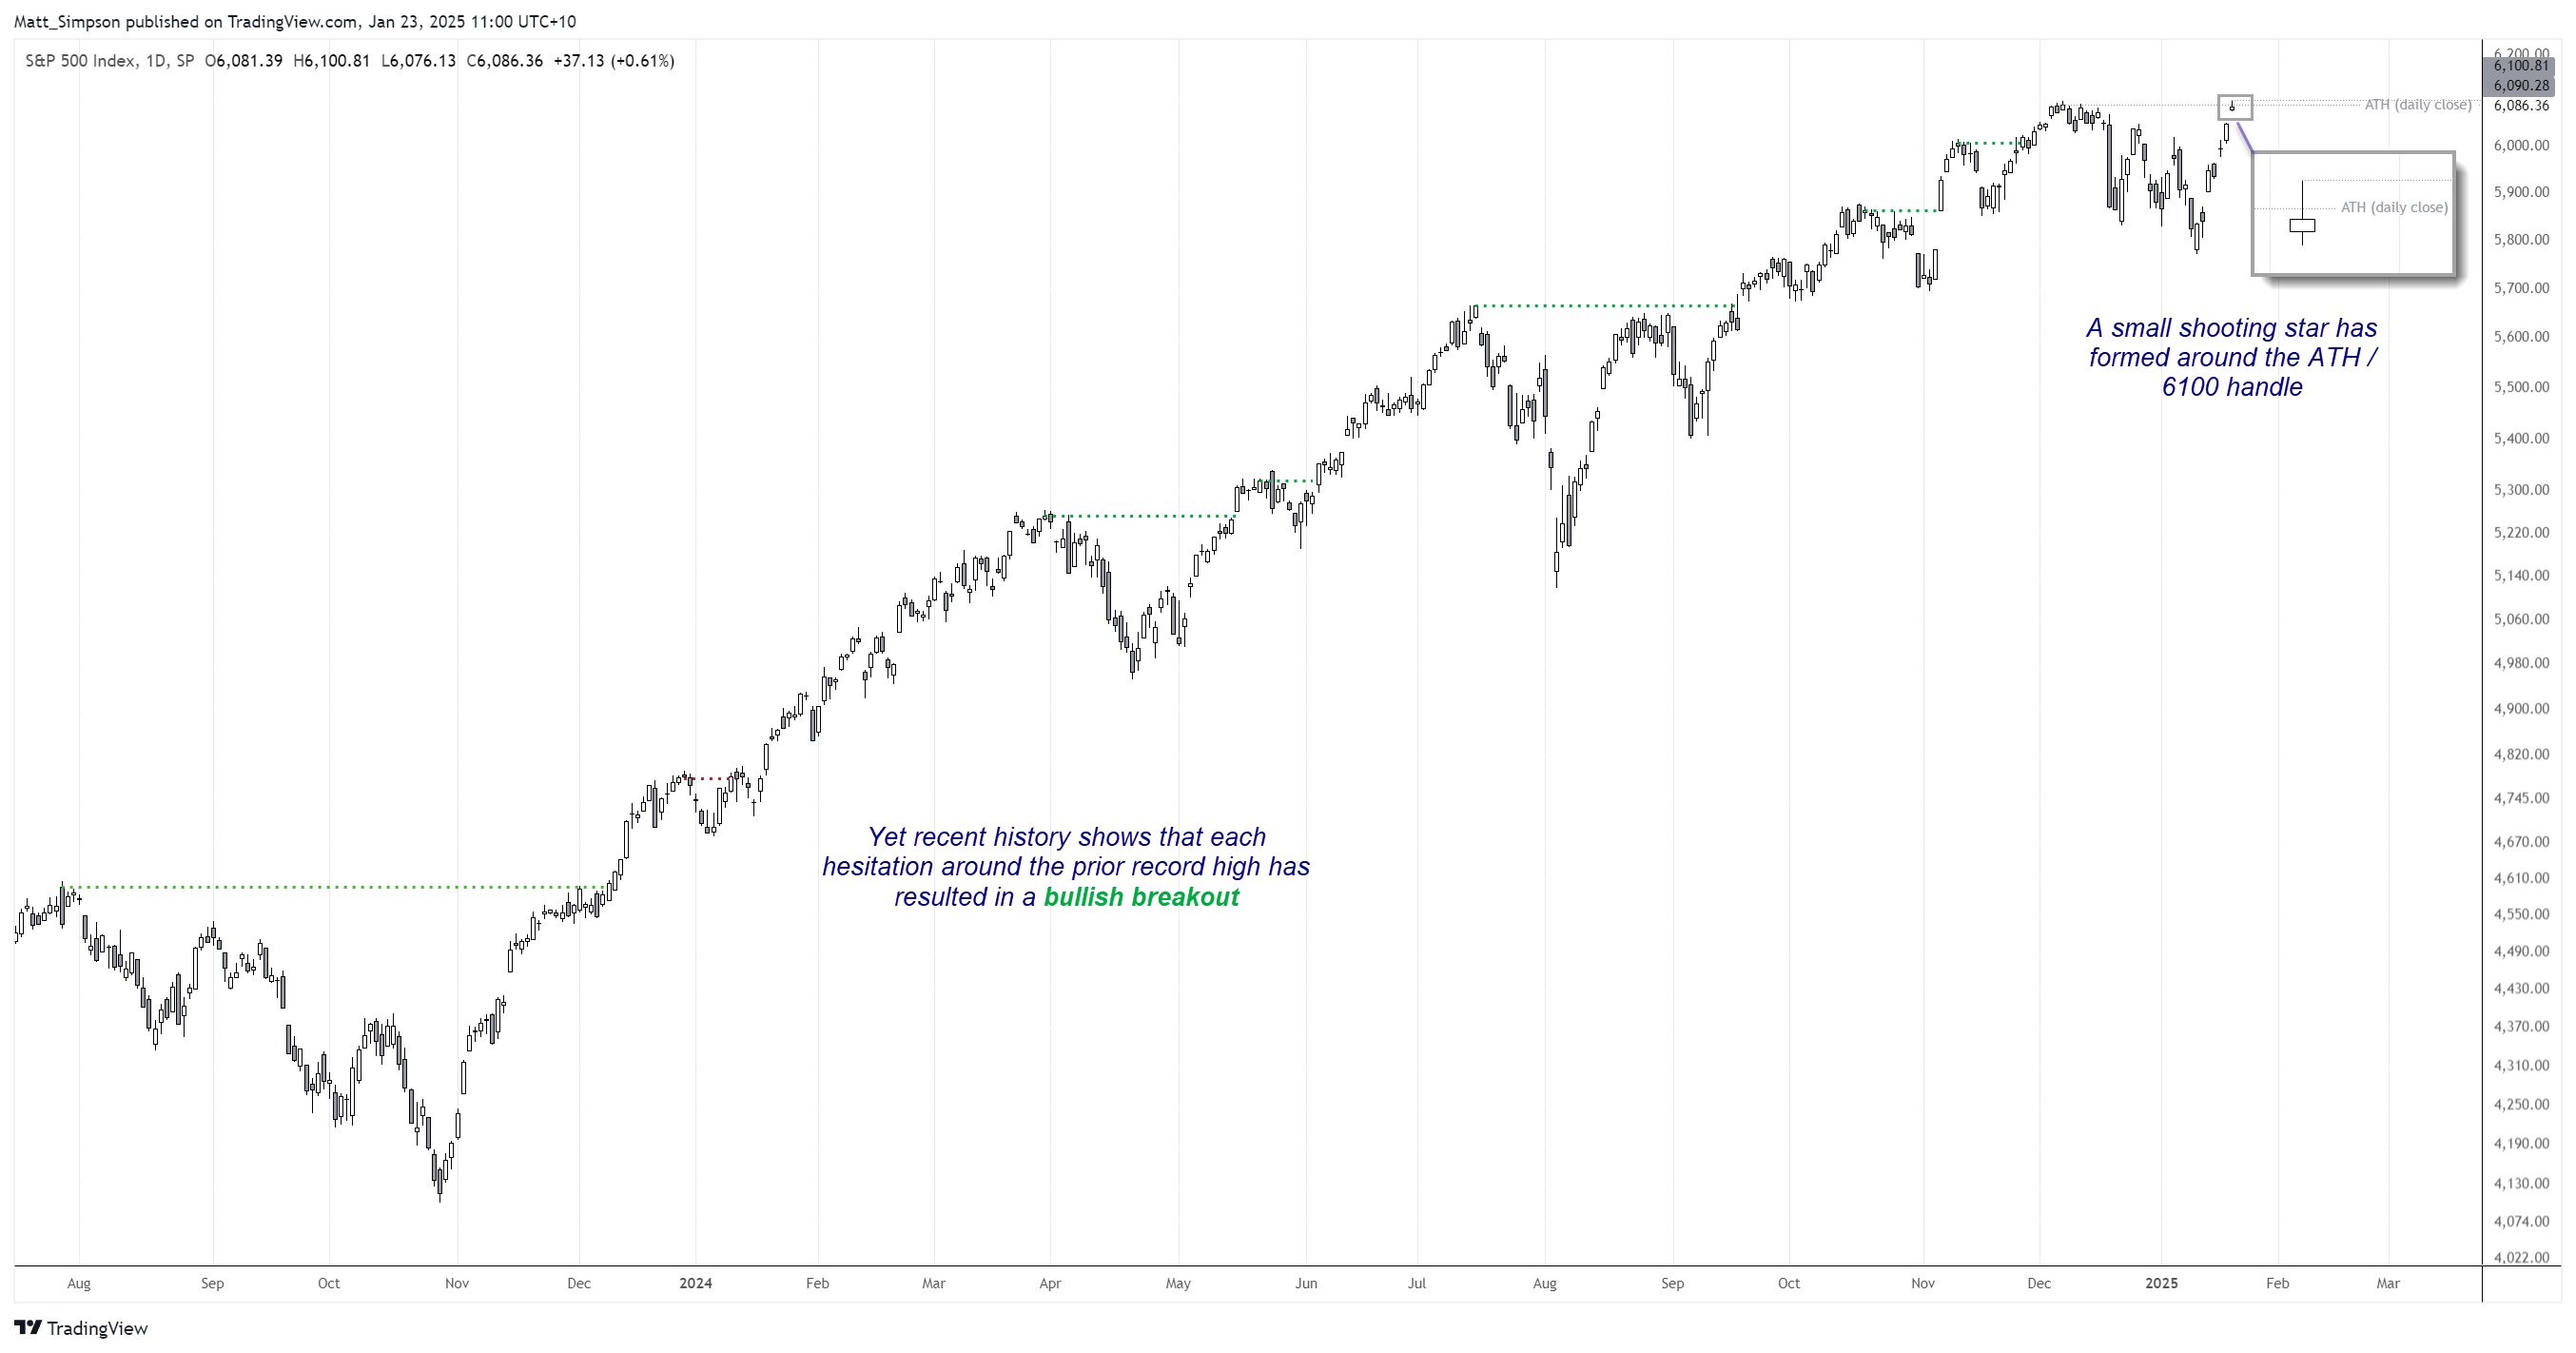
Depending on which metric you prefer, the S&P 500 either reached a record high on Wednesday or is tantalisingly close one. With a daily close of 6083.86, it trades less than 4 points below its all-time high (ATH) on the daily close chart. But if we’re to use the intraday high of 6100.81, a new one has been set.
Still, the fact the day closed with a mini shooting star which failed to close above 6100 shows a hesitancy for the market to push higher. What makes it odd is that it was done on Trump’s first full day in office. Traders are clearly in watch and wait mode, seeking the next catalyst with a clear line in the sand for bulls and bears at 6100.
The technical analyst within me naturally has me on guard for a pullback. But a glimpse at recent history shows that each hesitancy around a prior record high has generally resulted with a bullish breakout. And the one time it didn’t resulted in a mere 3-day retracement before the bullish trend resumed anyway.
S&P 500, Dow Jones, Nasdaq 100 futures
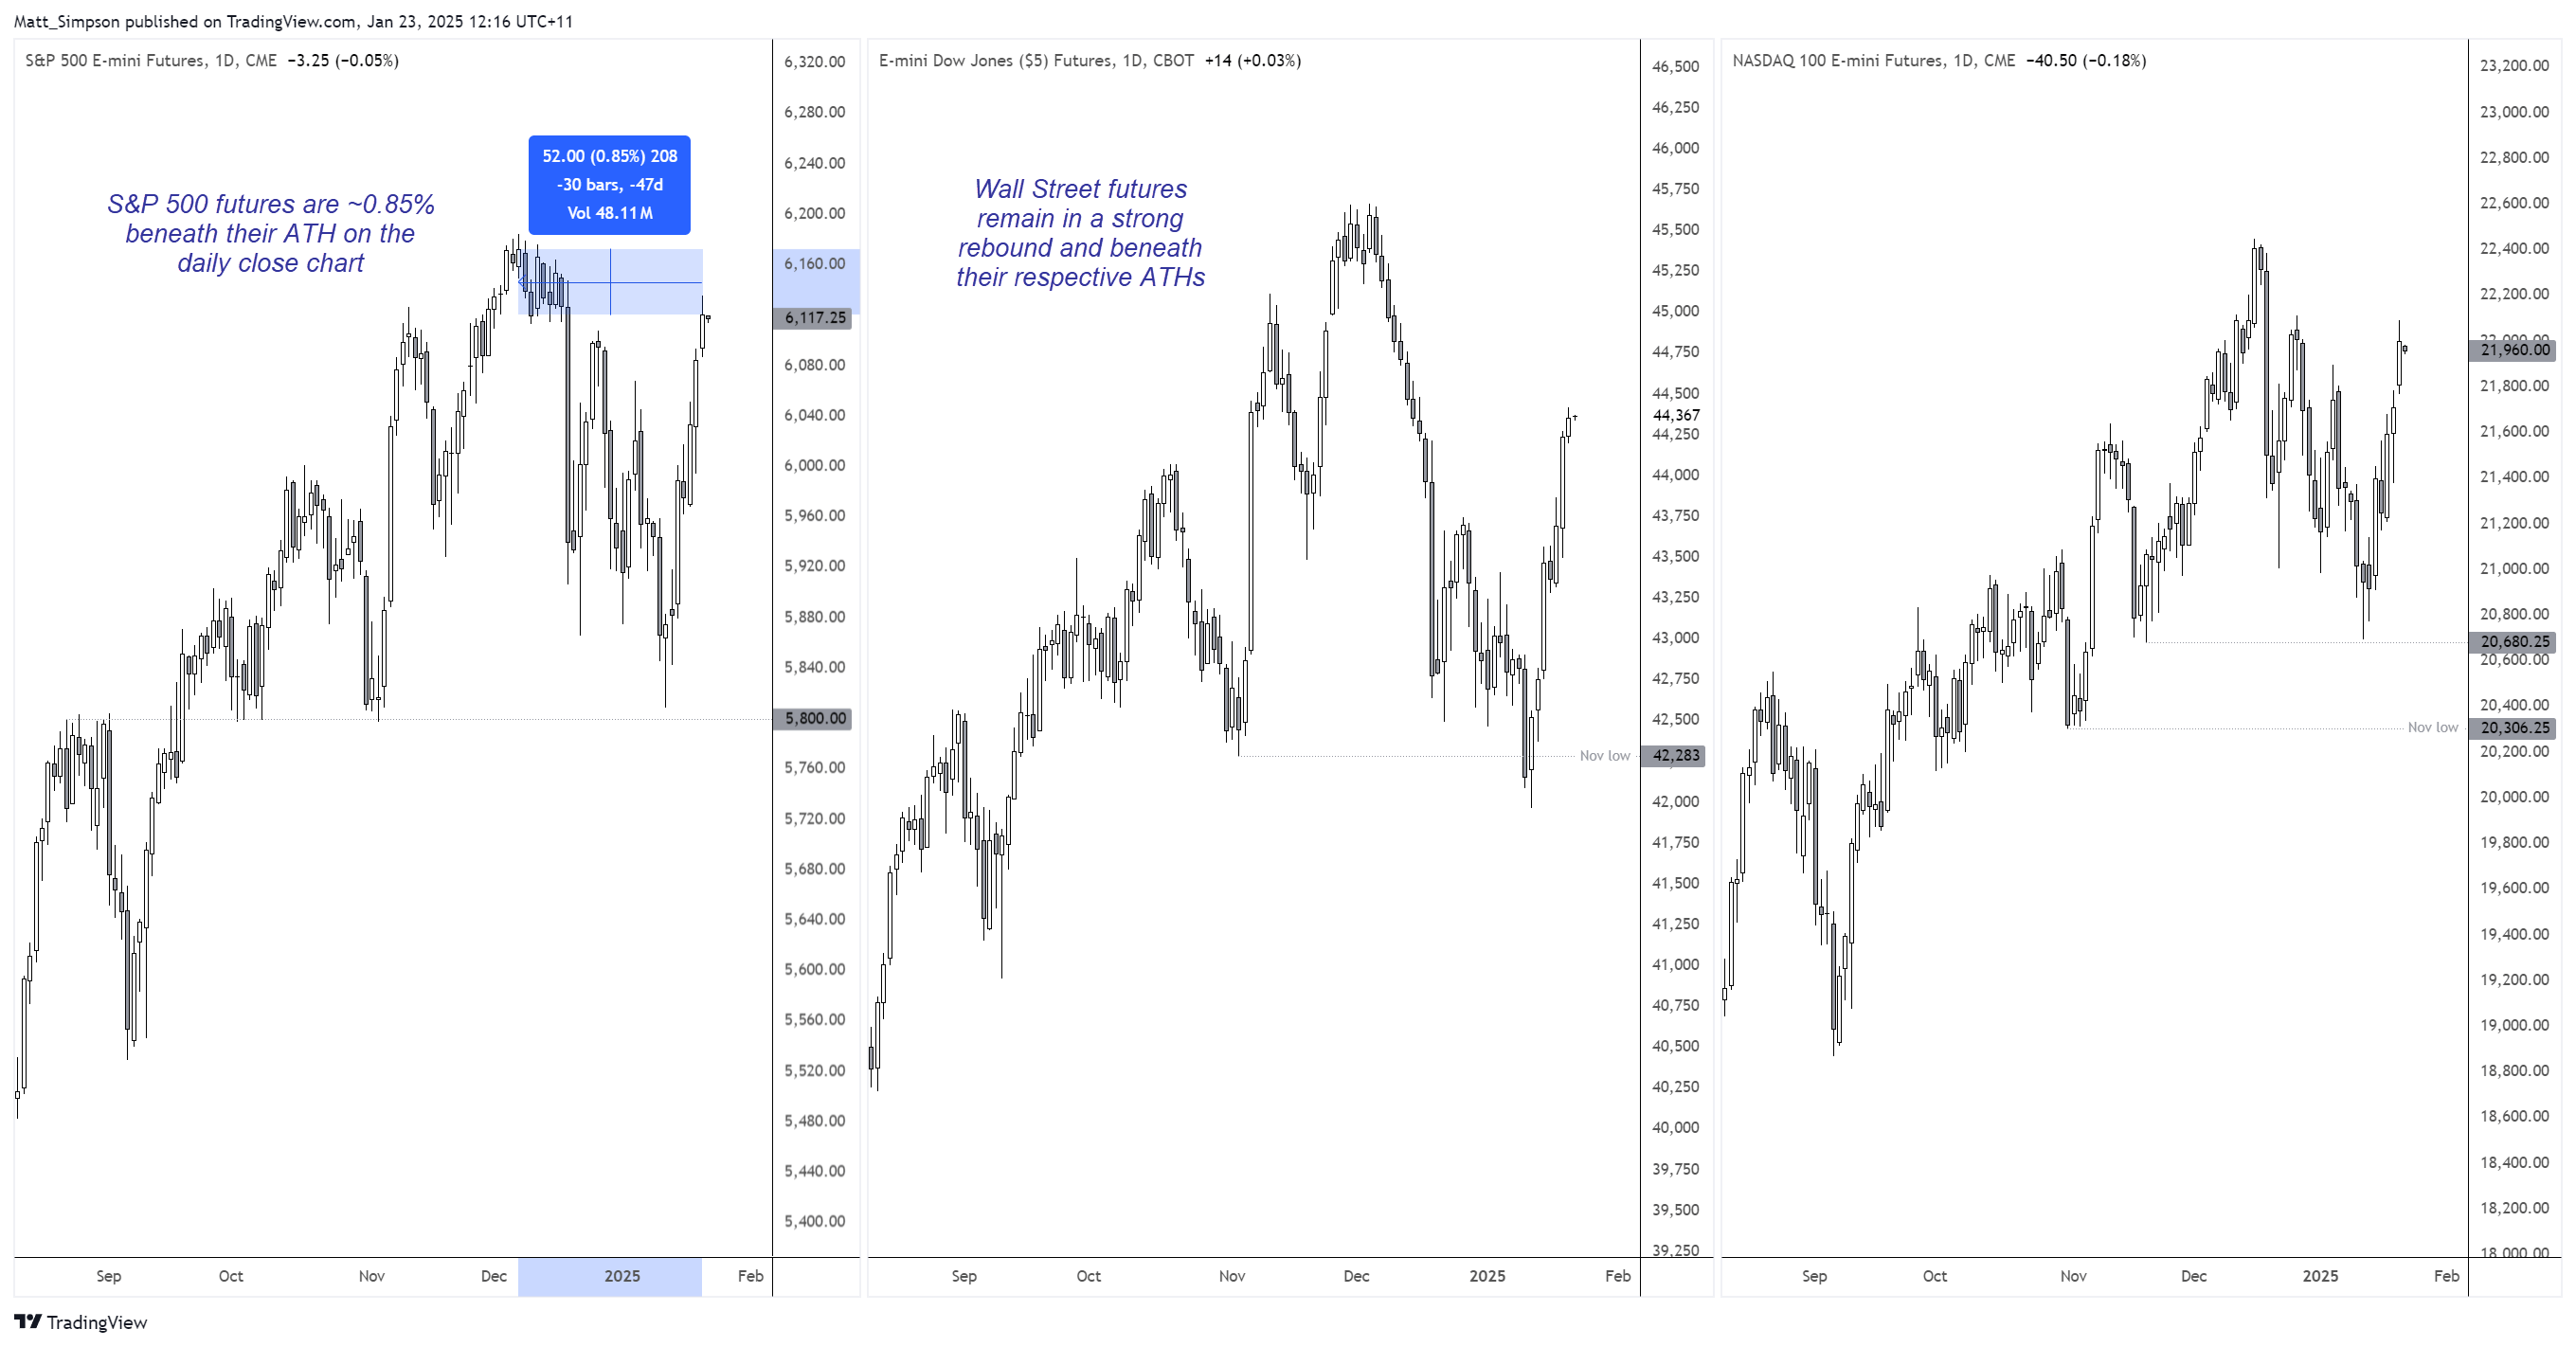
Price action on Wall Street futures also suggests some further upside for the S&OP 500 cash index. The S&P 500, Dow Jones and Nasdaq 100 futures charts are amid a strong bounce from their respective support levels from last week, and each market appears to have some more headroom before reaching testing their record high – which could act as resistance.
S&P 500 futures are ~0.85% beneath the record high, which translates to ~50 points of upside for the S&P 500 cash index before the futures market retests its ATH. Therefore, my near-term bias is for further gains on Wall Street, unless of course a fresh, bearish catalyst arrives.
S&P 500 futures market positioning – COT report
One thing to keep in mind however is that asset managers are not as bullish on the US stock market as they were. While they remain heavily net-long S&P 500 futures, asset managers reduced their gross-long exposure for a seventh week. -42k long contracts were close last week, and -152k were closed over the last seven. They also increased their gross-short exposure by 23.4k contracts to drag net-long exposure to a 23-week low.
This may not spell impending doom and still allows the S&P 500 to continue higher. But if the trend of real-money accounts pulling out of, or betting against the S&P 500 continues, it could spell trouble for the stock market.
How to trade with City Index
You can easily trade with City Index by using these four easy steps:
- Open an account, or log in if you’re already a customer
• Open an account in the UK
• Open an account in Australia
• Open an account in Singapore
- Search for the company you want to trade in our award-winning platform
- Choose your position and size, and your stop and limit levels
- Place the trade
How to trade with FOREX.com
Follow these easy steps to start trading with FOREX.com today:
- Open a Forex.com account, or log in if you’re already a customer.
- Search for the pair you want to trade in our award-winning platform.
- Choose your position and size, and your stop and limit levels.
- Place the trade.
Related tags:



Open an account in minutes
Experience award-winning platforms with fast and secure execution, and enjoy tight spreads from 0.5 pts on FX and 0.3 pts on indices.
Economic calendar
Web Trader platform
Our sophisticated web-based platform is packed with features.
Related articles

S&P 500 Forecast: SPX Continues to Drift Away from Record Highs
Recent trading sessions have done little to restore confidence in the equity market. Over the last four sessions, the S&P 500 has declined by nearly 1.00%, a move that highlights growing short-term weakness and keeps the index moving further away from its record-high territory.


S&P 500 Forecast: SPX rises after cooler-than-expected inflation data
U.S. stocks are rising and Treasury yields are falling after data showed that inflation increased at a cooler pace than expected, while U.S. consumer spending rose again in August.


The RBA Hiked Rates and the Australian Dollar Still Fell
AUD/USD fell after the RBA rate hike because the central bank's hawkish stance was already priced in while the U.S. dollar stayed firm.

This report is intended for general circulation only. It should not be construed as a recommendation, or an offer (or solicitation of an offer) to buy or sell any financial products. The information provided does not take into account your specific investment objectives, financial situation or particular needs. Before you act on any recommendation that may be contained in this report, independent advice ought to be sought from a financial adviser regarding the suitability of the investment product, taking into account your specific investment objectives, financial situation or particular needs.
StoneX Financial Pte. Ltd., may distribute reports produced by its respective foreign entities or affiliates within the StoneX group of companies or third parties pursuant to an arrangement under Regulation 32C of the Financial Advisers Regulations. Where the report is distributed to a person in Singapore who is not an accredited investor, expert investor or an institutional investor (as defined in the Securities Futures Act), StoneX Financial Pte. Ltd. accepts legal responsibility to such persons for the contents of the report only to the extent required by law. Singapore recipients should contact StoneX Financial Pte. Ltd. at 6826 9988 for matters arising from, or in connection with the report.
In the case of all other recipients of this report, to the extent permitted by applicable laws and regulations neither StoneX Financial Pte. Ltd. nor its associated companies will be responsible or liable for any loss or damage incurred arising out of, or in connection with, any use of the information contained in this report and all such liability is hereby expressly disclaimed. No representation or warranty is made, express or implied, that the content of this report is complete or accurate.
StoneX Financial Pte. Ltd. is not under any obligation to update this report.
Trading CFDs carries a high level of risk that may not be suitable for some investors. Consider your investment objectives, level of experience, financial resources, risk appetite and other relevant circumstances carefully. The possibility exists that you could lose some or all of your investments, including your initial deposits. If in doubt, please seek independent expert advice. Visit www.forex.com/en-sg/terms-and-policies for the complete Risk Disclosure Statement.