





S&P 500 Forecast: SPX Bearish Bias Finds Key Support
The SPX has dropped over 7.0% since its most recent peak on February 19, when it climbed to the 6,150-point range.
Share this:

The SPX has accumulated a decline of more than 7.0% since its last recorded peak on February 19, when it reached the 6,150-point zone. The strong downward trend has been reinforced by growing global tensions due to the new tariffs imposed by the White House and concerns about a potential employment slowdown in the short term.
Tariffs Continue to Impact the Market
Last week, President Donald Trump’s administration officially imposed a 25% tariff on all imports from Canada and Mexico. Although negotiations remain a possibility, for now, this measure will be in effect for the short term. Additionally, a 10% tariff was announced on Chinese products, and later this week, a 25% tariff on steel and aluminum is expected to be formalized, according to Commerce Secretary Howard Lutnick.
A key aspect is that Trump himself acknowledged that there is a transition period for these tariffs, stating that the ultimate goal of his plan is to "bring wealth back to the United States." Some analysts interpret this statement as an admission that his policies may be negatively impacting the economy in the short term.
Meanwhile, affected countries have begun implementing retaliatory tariffs. China, for example, has announced immediate tariffs on U.S. agricultural products. This escalation in trade tensions has increased concerns that the new trade war could be prolonged.
The SPX has experienced significant declines in recent sessions due to a loss of investor confidence. The new tariffs could increase production costs for U.S. companies that depend on imports from China and other countries. Additionally, the expected rise in domestic product prices in the U.S. could eventually lead to a decline in consumption, fueling pessimism in the markets.
U.S. multinational companies now face a combination of higher operational costs, reduced domestic demand (due to higher prices), and a loss of confidence in the economy. This uncertainty has weakened corporate return expectations, intensifying the bearish pressure on the SPX. If tariffs continue to impact the economy, the selling trend is likely to persist in the short term.
What About Employment?
The NFP report published on Friday showed the creation of 151,000 new jobs, below the expected 160,000. Although this figure remains higher than the previous report of 125,000, a clear downward trend in employment has been observed since February 2024, when job creation reached levels near 353,000.
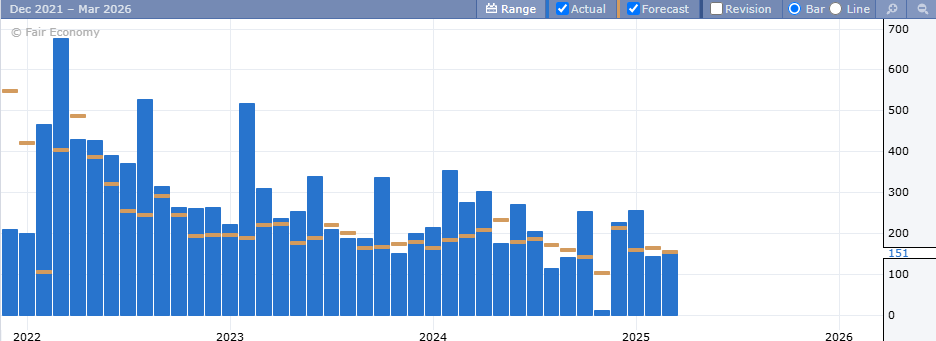
Source: ForexFactory
This decline in job growth suggests that the labor market trend has deteriorated in recent months, reaching levels not seen since 2022. This situation is concerning for stock markets, as lower job creation reduces consumer spending, directly affecting corporate earnings and indexes such as the SPX.
If the downward employment trend continues with no signs of recovery, the selling pressure on the SPX is likely to persist.
S&P 500 Technical Outlook
Source: StoneX, Tradingview
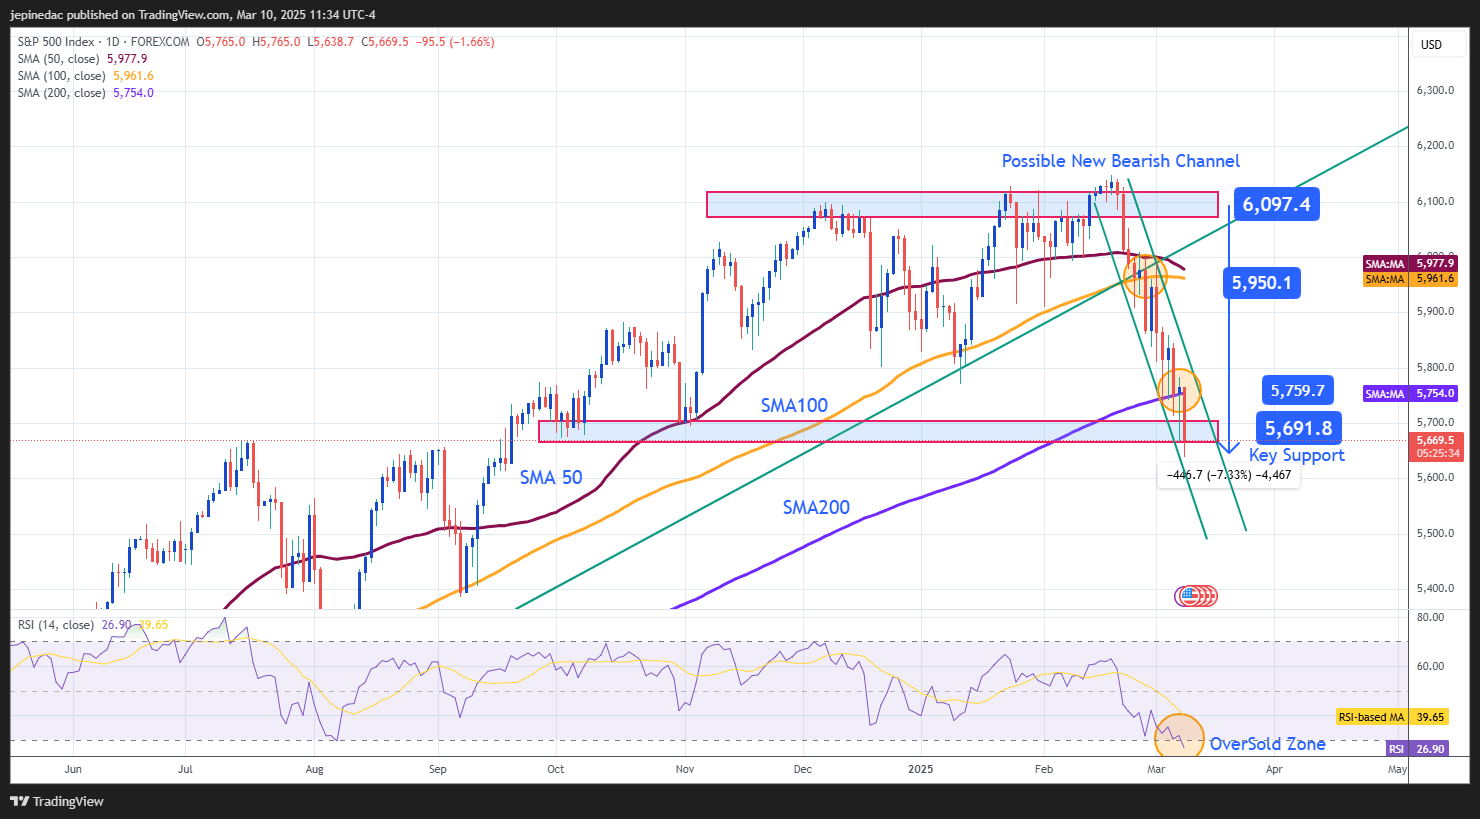
- New Potential Downward Channel: Since February 18, the SPX has begun to develop a new short-term bearish channel, breaking below the 50-period and 100-period simple moving averages and, more recently, the 200-period simple moving average.
The strong downward pressure has pushed the SPX to test a key support level, which could trigger short-term bullish corrections.
- RSI (Relative Strength Index): The RSI maintains a steep negative slope and has crossed the oversold threshold at 30. This suggests an imbalance between buying and selling pressure over the last 14 sessions, which could lead to short-term bullish corrections.
Key Levels:
- 5,690 points – Crucial Support: This level represents the lowest point since October last year and is the most significant barrier within the current bearish channel. If the price breaks below this level, the downward trend could accelerate, with stronger bearish pressure in the short term.
- 5,760 points – Near-Term Resistance: This level coincides with the 200-period moving average and could act as a barrier for potential bullish corrections in the upcoming sessions.
- 5,950 points – Key Resistance: Located at the convergence of the 100-period and 50-period moving averages, along with the previous upward trendline. If the price returns to this level, the bullish bias could be reactivated, although the struggle between buyers and sellers might lead to a prolonged consolidation phase.
Written by Julian Pineda, CFA – Market Analyst
Latest market news



Open an account in minutes
Experience award-winning platforms with fast and secure execution, and enjoy tight spreads from 0.5 pts on FX and 0.3 pts on indices.
Economic calendar
Web Trader platform
Our sophisticated web-based platform is packed with features.
Related articles
S&P 500 forecast: Stocks extend drop as correction risks grow
US and global equity markets have extended Wednesday’s sell-off, with Wall Street opening lower after a weak handover from Asia and Europe. The deterioration in risk appetite has been spreading across global markets. The dollar was firmer, Treasury yields were holding onto yesterday’s gains, while gold, silver and bitcoin were all under pressure alongside equities and major currencies.

USD/CAD Analysis: Is the Canadian Dollar Running Out of Support?
A new trading week is underway, and the Canadian dollar continues to show signs of weakening momentum. This can be seen in recent USD/CAD price action, with the pair gaining nearly 0.7% over the last four trading sessions.

S&P 500 Forecast: SPX higher as oil & yields fall, AI stocks rise
U.S. stocks have opened higher as Treasury yields retreat and crude oil prices fall to an 11-day low.

This report is intended for general circulation only. It should not be construed as a recommendation, or an offer (or solicitation of an offer) to buy or sell any financial products. The information provided does not take into account your specific investment objectives, financial situation or particular needs. Before you act on any recommendation that may be contained in this report, independent advice ought to be sought from a financial adviser regarding the suitability of the investment product, taking into account your specific investment objectives, financial situation or particular needs.
StoneX Financial Pte. Ltd., may distribute reports produced by its respective foreign entities or affiliates within the StoneX group of companies or third parties pursuant to an arrangement under Regulation 32C of the Financial Advisers Regulations. Where the report is distributed to a person in Singapore who is not an accredited investor, expert investor or an institutional investor (as defined in the Securities Futures Act), StoneX Financial Pte. Ltd. accepts legal responsibility to such persons for the contents of the report only to the extent required by law. Singapore recipients should contact StoneX Financial Pte. Ltd. at 6826 9988 for matters arising from, or in connection with the report.
In the case of all other recipients of this report, to the extent permitted by applicable laws and regulations neither StoneX Financial Pte. Ltd. nor its associated companies will be responsible or liable for any loss or damage incurred arising out of, or in connection with, any use of the information contained in this report and all such liability is hereby expressly disclaimed. No representation or warranty is made, express or implied, that the content of this report is complete or accurate.
StoneX Financial Pte. Ltd. is not under any obligation to update this report.
Trading CFDs carries a high level of risk that may not be suitable for some investors. Consider your investment objectives, level of experience, financial resources, risk appetite and other relevant circumstances carefully. The possibility exists that you could lose some or all of your investments, including your initial deposits. If in doubt, please seek independent expert advice. Visit www.forex.com/en-sg/terms-and-policies for the complete Risk Disclosure Statement.